
")
Welcome to the ultimate crypto market forecast 2026. Aussie investors need clear facts today. The digital asset sector faces heavy pressure right now.
We see relentless downward momentum this Tuesday. Weak risk appetite ruins demand for digital assets. This reality limits price movement across the board.
Bitcoin Struggles Below Key Levels
Bitcoin continues its nasty slide below the $60,000 mark. Unceasing ETF outflows destroy current market confidence. Bitcoin trades near $59,419 with a clear bearish bias.
The spot price sits well below major moving averages. The 50-day EMA sits exactly at $66,623. The 100-day EMA rests higher at $70,329.
These levels keep the broader trend under downside pressure. Initial resistance waits at the Bollinger middle band. You will find this middle band around $62,687.
A huge wall exists between $60,500 and $61,000. Previous support levels have officially flipped into fierce resistance. Immediate support lies near the $58,279 mark.
This level represents the lower Bollinger band. A clean break below exposes fresh market weakness. The next meaningful support sits between $54,000 and $55,000. Bulls must defend these levels to prevent utter disaster.
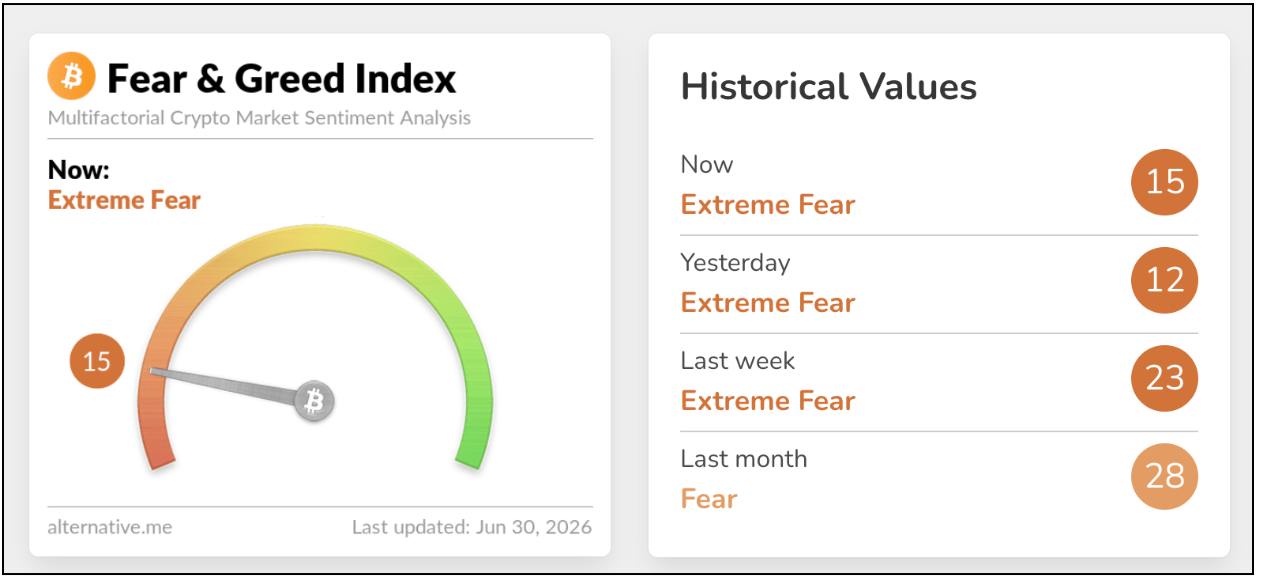 Fig 1: Crypto Fear & Greed Index [fxstreet.com]
Ethereum Price Prediction 2026: February Echoes
Let us pivot to our Ethereum price prediction 2026. Ethereum sellers recently tightened their grip on the market. The token continues to slide below $1,600.
Institutions constantly reduce their overall risk exposure here. Ethereum currently trades around the $1,585 mark. The asset maintains a very bearish near-term bias.
The daily chart closely mirrors a familiar February structure. We see horizontal lows and an oversold first low. A higher RSI low suggests some early momentum recovery.
This pattern could deliver a modest relief rally soon. Ethereum fiercely holds the $1,500 to $1,600 support zone. Resistance sits near the Bollinger centerline at $1,672.
A broader supply zone sits much higher up. The 200-day EMA at $2,292 caps deeper corrective bounces. Immediate support rests at the lower band of $1,527. A decisive drop below opens doors to historical lows.
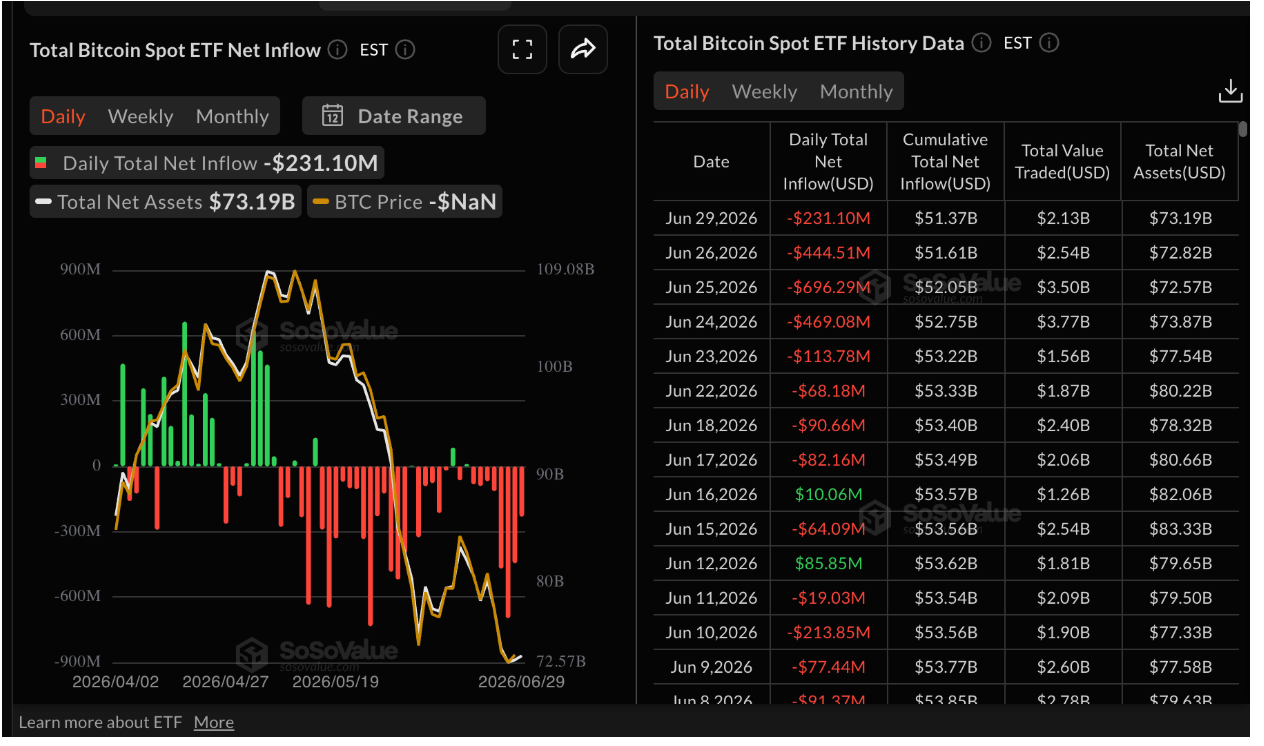 Fig 2: Bitcoin ETF flows [CoinGlass]
XRP Defies the Odds
XRP displays a completely different energy this week. Sellers slowly lose momentum rather than buyers taking control. XRP trades near $1.04 right now.
The token remains under sustained bearish pressure overall. However, buyers actively defend the $1.00 psychological support level. Support clearly sits between $0.90 and $1.00.
We just witnessed a strong bounce from exactly $1.00. Initial resistance sits near the $1.12 middle band. Another solid resistance wall waits at $1.13.
XRP spot ETFs defy the current bearish crypto outlook. Inflows steadied above $15 million on Monday alone. Cumulative deposits now reach $1.48 billion.
Net assets under management total around $972 million. Institutions clearly see a bullish picture for this asset. They increase exposure even as prices falter near $1.00.
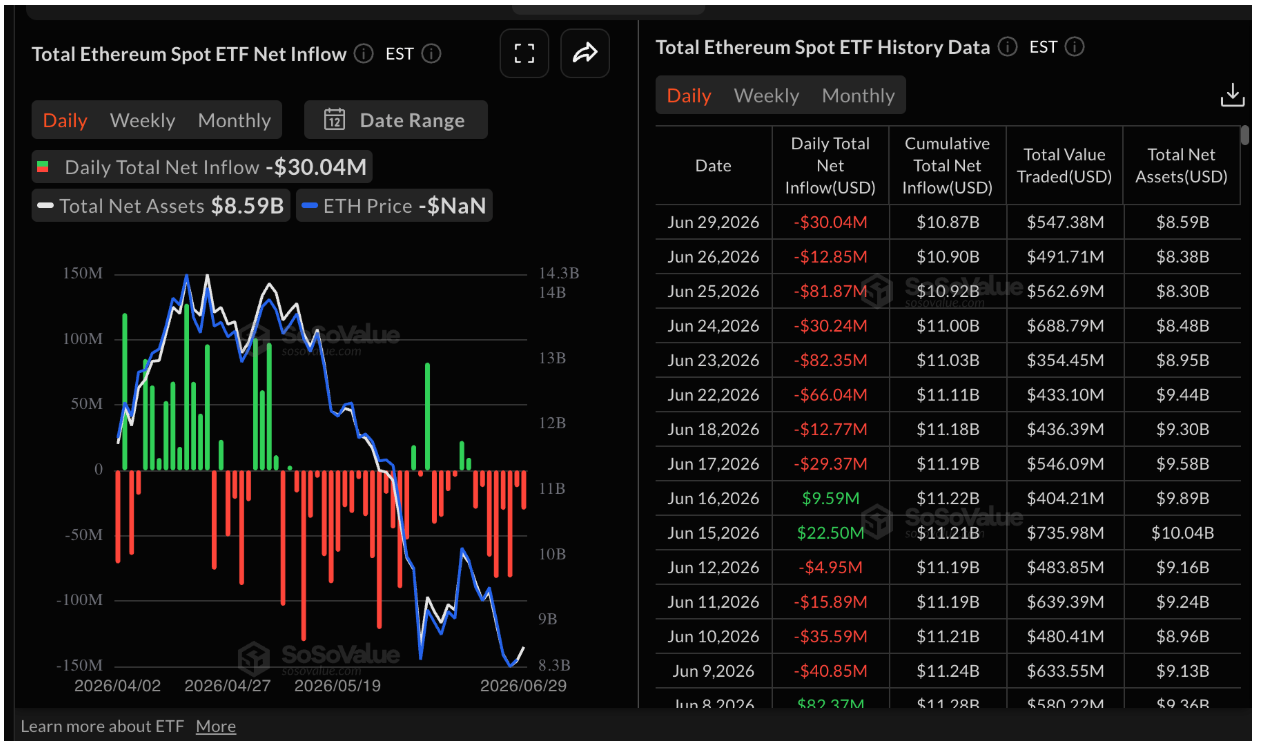 Fig 3: Ethereum ETF flows [SoSoValue]
Institutional Moves and ETF Flows
Let us examine the current crypto market outlook 2026. Sentiment remains trapped in Extreme Fear at 15. This index moved up slightly from 12 yesterday.
Broad crypto market sentiment stays significantly subdued right now. Outflows from US-listed Bitcoin spot ETFs look absolutely brutal. We saw $231 million withdrawn on Monday alone.
This marks the eighth consecutive day of net redemptions. Such immense withdrawals reinforce the ongoing bearish market narrative. These outflows underscore rapidly waning institutional interest.
Ethereum spot ETFs present a similarly grim picture today. Outflows totalled $30 million on Monday. Friday only saw nearly $13 million in total outflows.
These Ethereum outflows also persist for eight consecutive days. Ongoing market caution dominates institutional trading floors globally.
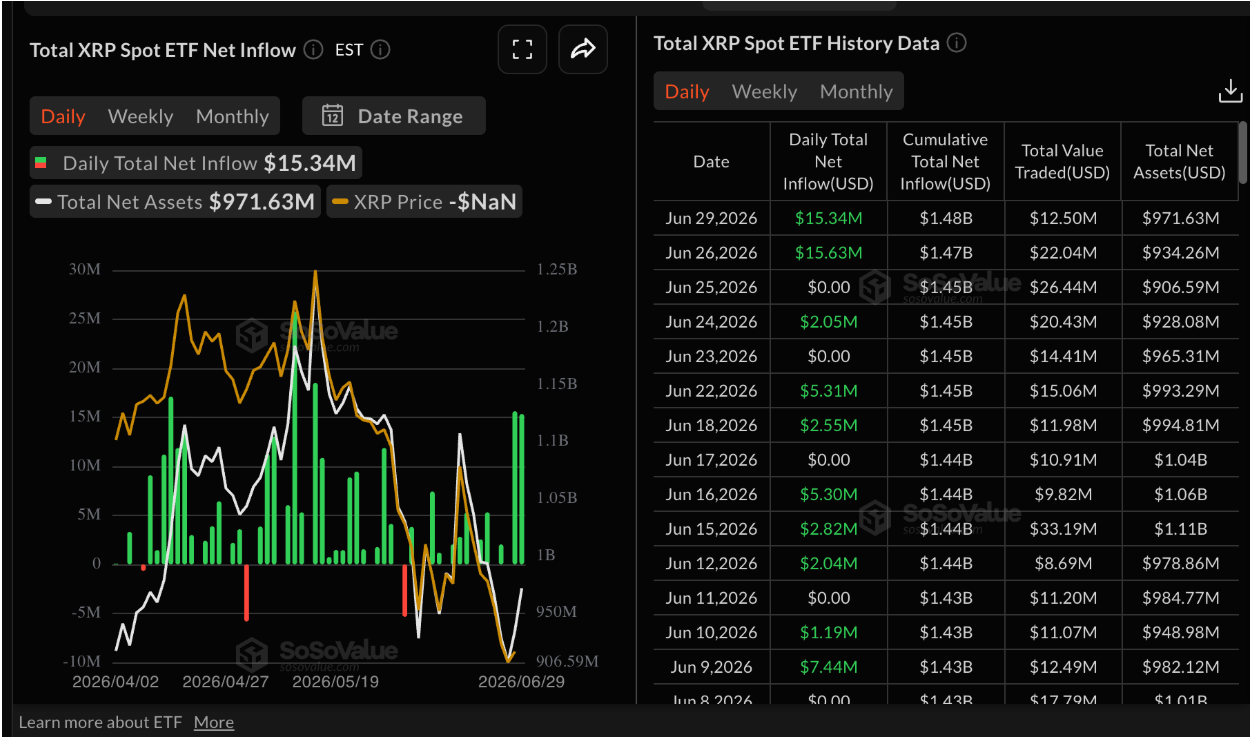 Fig 4: XRP ETF flows [SoSoValue]
Technical Analysis
The liquidation heatmap reveals fascinating targets for Bitcoin traders. Significant liquidity sits clustered tightly above at $62,000. More liquidity hides between $63,200 and $63,500.
A push toward $62,000 seems totally plausible soon. Bulls just need to clear that stubborn resistance first. A smaller liquidity pocket builds quietly below at $58,000.
This lower zone becomes a primary bearish target. A weak US market open triggers this exact move. A nasty drop invalidates short-term recovery signals.
Bitcoin’s three-day chart reveals crucial support dynamics. Bitcoin holds firmly above the critical $60,000 level. We lack a confirmed candle close below this mark.
A bullish divergence appears across multiple important trading timeframes. You can see this on the 12-hour chart. The eight-hour and daily timeframes show it too.
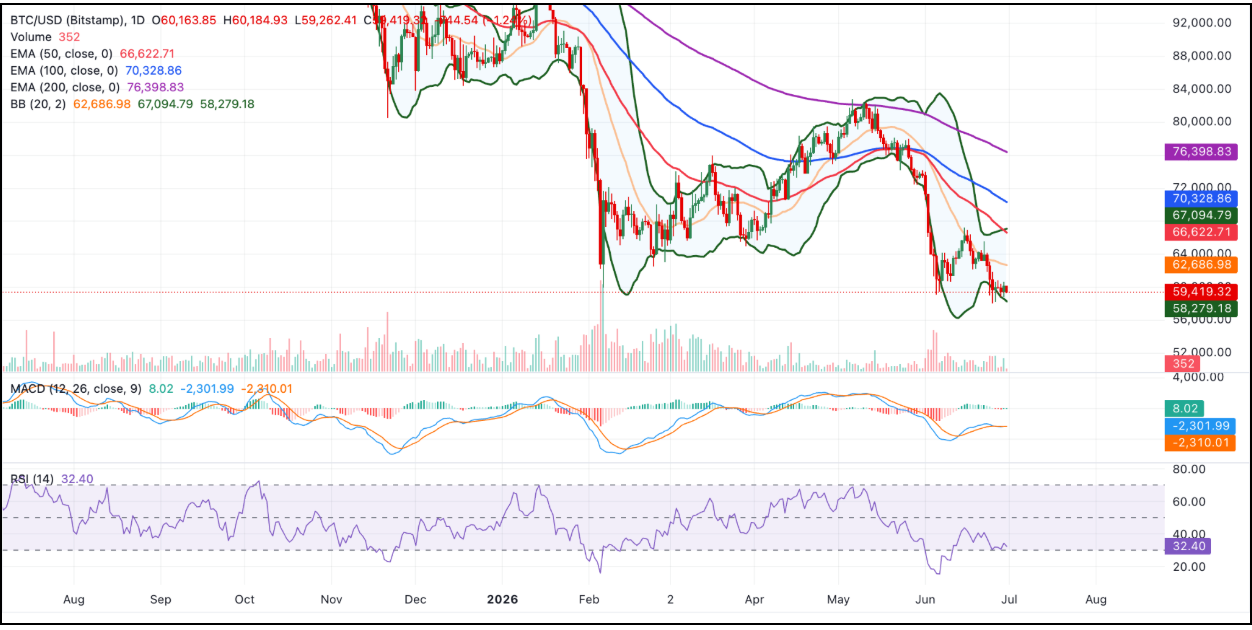 Fig 5: BTC/USDT daily chart [fxstreet.com]
Lower price lows pair with higher RSI lows. This unique signal produced a short-term market relief. It temporarily paused the recent extreme selling pressure.
However, this relief stalled directly at the resistance zone. The $60,500 to $61,000 area blocks upward momentum. The weekly timeframe shows a large bullish divergence forming.
Traders wait patiently because it remains entirely unconfirmed. The crucial super trend indicator still flashes red. Let us look deeper into the Bitcoin technicals.
Bollinger Bands show spot trading beneath the midline. Persistent selling interest remains very clear today. We only see a modest uptick in momentum lately.
The MACD histogram stays positive on the daily chart. The RSI edges away from oversold territory at 32. This hints at a potential corrective bounce ahead. It does not indicate a full trend reversal yet.
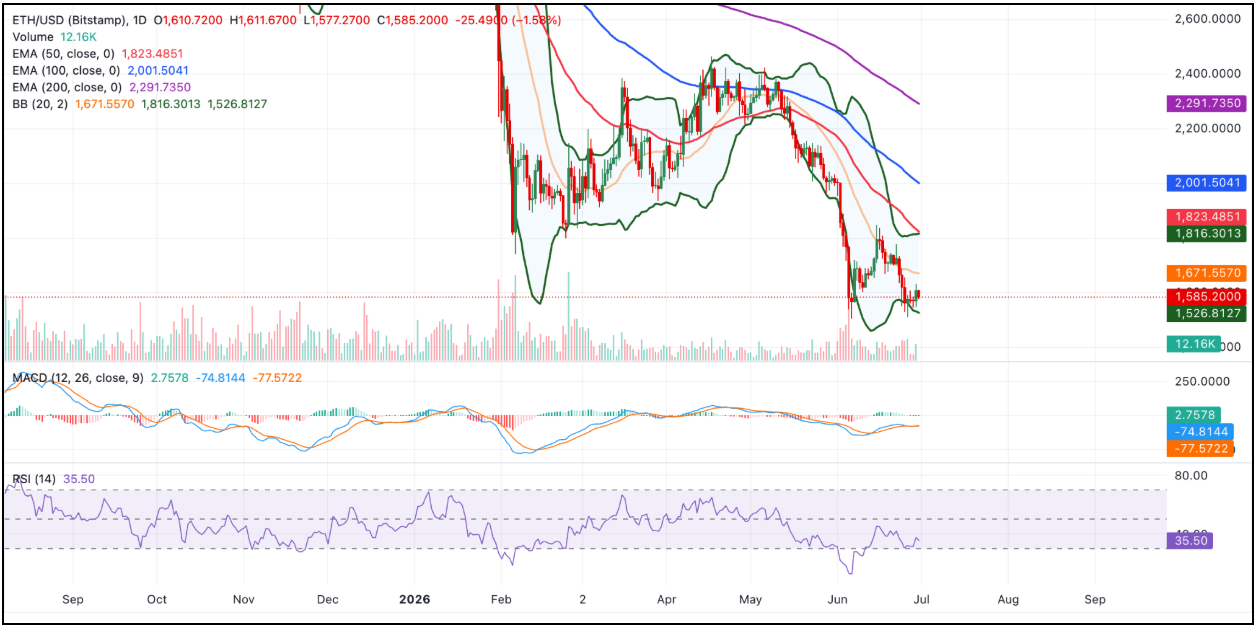 Fig 6: ETH/USDT daily chart [fxstreet.com]
Crypto Market Outlook 2026: What Happens Next?
Let us expand on Ethereum’s daily moving averages. The 50-day EMA sits exactly at $1,823. The 100-day EMA rests a bit higher at $2,002.
All these averages sit squarely overhead right now. They actively reinforce a heavily capped market structure. A modestly positive MACD histogram hints at recovery.
However, these attempts remain tentative within a broader downtrend. The Ethereum RSI currently sits near the 36 mark. This indicator remains comfortably below the daily midline.
It suggests weak but not extreme selling pressure. An upper Bollinger band sits right at $1,816. This forms a tough barrier ahead of the EMA. Ethereum continues to hold its crucial support zone securely.
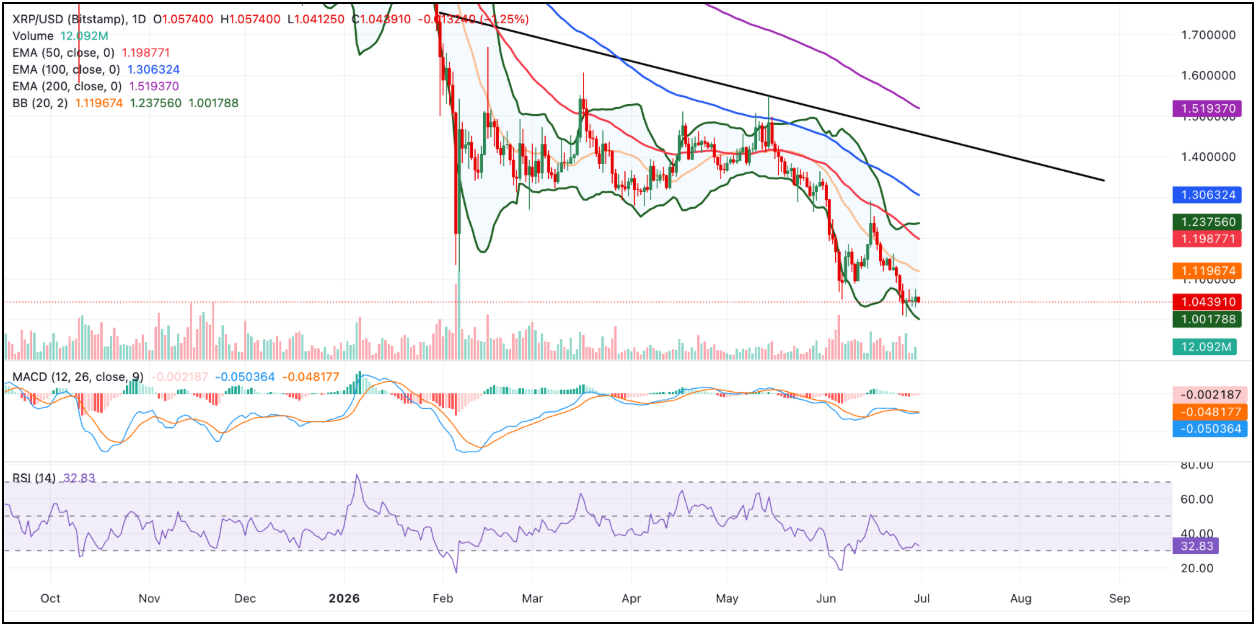 Fig 7: XRP/USDT daily chart [fxstreet.com]
Let us evaluate the XRP technical outlook. XRP extends a bearish phase well beneath moving averages. The 50-day EMA sits overhead at $1.20.
The 100-period EMA rests slightly higher at $1.31. These levels reinforce a heavily capped tone today. The pair drifts near its lower Bollinger envelope.
The XRP RSI stays in weak territory around 33. The MACD histogram remains slightly negative right now. Downside momentum persists despite the moderating sell-off.
The past two days produced extremely small candle bodies. This represents a classic outcome of bullish divergence. Flat price action remains the most likely immediate outcome.
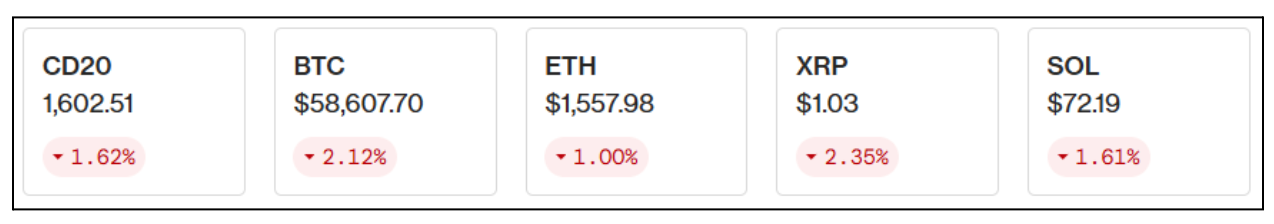 Fig 8: Crypto price [coindesk.com]
Final Thoughts for Aussie Investors
Despite outflows, Bitcoin ETF inflows remain positive. Cumulative inflows total $51.37 billion. Net assets under management average a healthy $71.19 billion.
This proves long-term money still backs the flagship asset. Ethereum cumulative inflows also remain remarkably robust today. They sit proudly at $10.87 billion.
Total assets under management stand at $8.59 billion. Long-term investor interest has not fully diminished yet. Monday’s US market open acts as a major catalyst.
A stable open gives Bitcoin plenty of breathing room. It allows a target of the $62,000 liquidity zone. Aussie traders must monitor these developments very closely.
Smart investors always follow the institutional money trails. We expect volatility as this week progresses. Stay sharp and protect your trading capital today.
Also read: Bitcoin Stuck in Range: Will a Breakdown Trigger the Next Big Move in 2026?
FAQ
Q: Why does XRP look completely different from the rest of the bleeding market?
A: XRP actively defies the current bearish trend thanks to sustained ETF inflows and exhausted sellers.
Q: What is the single biggest near-term catalyst for a market reversal?
A: A stable US market open is the absolute key to pushing Bitcoin toward the $62,000 liquidity zone.
Also read: Australia’s Crypto Future: Why Trust Will Define Mainstream Finance by 2030
Disclaimer
This article is meant only for informational purposes. If you are an investor who is watching crypto market closely, all the data published in the content is sourced from announcements and external sources. Kindly verify all information related to the share price and market data. Any investment should be made at the investor’s own risk.
————————
Sources:
https://coinpedia.org/news/crypto-market-today-bitcoin-ethereum-and-xrp-price-prediction/