

Bitcoin pullback analysis reveals the digital currency is consolidating after hitting a 12-week high just below $79,399. The cryptocurrency saw an abrupt U-turn during Monday’s trading hours in Asia. It marks the third rejection from above $79,000 in eight sessions.
The digital currency was trading at $77,705, down 0.4 percent for the day and down 0.4 percent for the last 24 hours. The upward momentum led the cryptocurrency towards the $80,000 price point before selling pressure came to play.
As you can see, the technical resistance levels play a pivotal role when analyzing price action, and buyers were quick to exit their position at this resistance zone, leading to an immediate selloff, further signaling a period of consolidation rather than an immediate new all-time high.
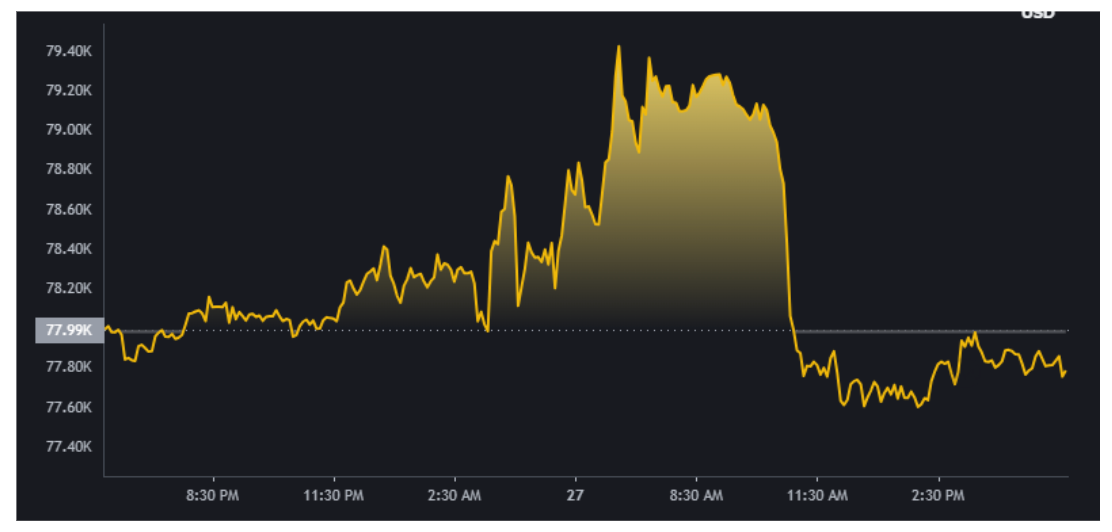 Bitcoin reverses after testing the $79,400 resistance level during Asian trading. [Courtesy: Binance]
Why Bitcoin Pullback Analysis Highlights Seller Wall At $80,000
According to Bitcoin pullback analysis, the $80,000 price zone should act as a break-even zone, as we’ve seen many recent buyers enter positions around that area. As we retest that price level, traders will attempt to exit at breakeven or recover their losses.
These traders selling their assets in bulk result in sellers gaining momentum and overpowering buyers, this explains the inability of Bitcointo sustain rallies to $79,000 as expressed by BTC Markets.
Rachel Lucas; “It was hit with a flurry of selling around $79,000, preventing the push towards $80,000 to develop further due to the sell orders coming in.” Thus, a repeated rejection at $79,000 only serves to reaffirm this resistance zone.
How Iran Developments Fuelled And Then Faded Bitcoin Rally
The rally seen on Monday can be attributed to Iran’s reported proposed reopening of the Strait of Hormuz. This boosted the global risk sentiment briefly, with most major Asian equity markets opening with considerable gains.
Bitcoin also opened in line with this risk-on sentiment before diverging. Even as other global markets recovered and the sentiment toward this news faded slightly, Bitcoin’s rally remained, with Brent Crude oil dropping back from earlier gains.
This suggests that the cryptocurrency was driven primarily by this headline, and as the buying pressure eased with this news, Bitcoin dropped back from its highs during the same session.
 Geopolitical headlines triggered short-lived momentum across crypto and equity markets. [Courtesy: The Economic Times]
Where Bitcoin Stands After April’s 16 Percent Surge
Bitcoin pullback analysis indicates that despite the intraday dip, Bitcoin continues to display strength. The cryptocurrency is up 16 percent so far in April. The digital asset is set to achieve its largest monthly percentage gains since May 2025 if it holds current levels through the end of the month.
This increase in buying pressure can be attributed to institutions, as Strategy reported that it had bought roughly $3.9 billion worth of Bitcoin throughout April – its largest monthly accumulation in over a year.
Other digital currencies saw a slightly mixed day, as Ether shed 2.4 percent and Solana dropped 1.9 percent. BNB was down 1.2 percent during the day as markets seemed to be in a state of consolidation following the surge in value.
When Could Bitcoin Break Out of Its Current Trading Range
Bitcoin pullback analysis suggests that we may not see a major breakout from the current range just yet. Markets will be waiting keenly for announcements by the Federal Reserve and European Central Bank this week, which will set global liquidity and risk sentiment.
It is also earnings week, with the US major technology companies set to release their results; any positive results could add to the market sentiment.
Without strong news-driven catalysts, Bitcoin will likely continue to consolidate within the $79,000 range until enough buying pressure accumulates to break through the technical resistance.
 Investors await macroeconomic catalysts to drive Bitcoin’s next breakout attempt. [Courtesy: Yahoo Finance]
How Market Structure Signals Potential For Short Squeeze
Bitcoin pullback analysis also shows that the market conditions favor a potential short squeeze. Perpetual futures have a negative funding rate (-0.13% on a 7-day average), indicating that traders who bet against the cryptocurrency are paying traders who are betting on its success.
This may lead to short sellers quickly covering their position when the price approaches a specific level in order to avoid further losses, which could create a domino effect of buying and cause a rapid price increase.
This is made more challenging by the resistance level at $79,000. Repeated failures to breach $79,000 may mean that this setup would require significant strength.
What Bitcoin Pullback Analysis Means For Investors Now
Bitcoin pullback analysis shows a mix of short-term volatility and long-term strength. While the immediate price action shows caution and profit taking, the longer-term trend remains supported by consistent institutional buying.
The cryptocurrency seems to be in a consolidation period between its resistance at $79,000 and its support levels, with investors now weighing the next steps to take.
Macroeconomic events, technical analysis such as breaking through key levels, and institutional flows all remain important indicators that will shape the future direction of Bitcoin.
What Should Investors Watch Next In Bitcoin Pullback Analysis
In regard to Bitcoin pullback analysis, investors should watch the upcoming central bank interest rate decisions from both the Federal Reserve and European Central Bank this week, as these will have the potential to impact global liquidity.
The ongoing earnings reports from major US tech companies will provide insights into corporate profits and market sentiment. Any fresh geopolitical developments concerning Iran, along with trading volumes, institutional flows, and the ability for Bitcoin to reclaim support levels, will be key.
A break above the $79,400 resistance level may signal the beginning of a new bullish trend, while a drop below support will likely result in further consolidation.
Also Read: Bitcoin Price Climbs to a 12-Week High – Then Hits a Wall Nobody Saw Coming
FAQs
Q1. Why did Bitcoin fail to break $79,400?
A1: Bitcoin faced strong selling pressure near breakeven levels. Many traders exited positions, creating a resistance wall.
Q2. How much has Bitcoin gained in April?
A2: Bitcoin is up 16 percent in April. This marks its strongest monthly performance since May 2025.
Q3. What role do central banks play in Bitcoin’s movement?
A3: Federal Reserve and ECB decisions impact liquidity. This influences investor risk appetite and crypto demand.
Q4. What does a negative funding rate mean for Bitcoin?
A4: A -0.13 percent funding rate shows shorts paying longs. This setup can lead to a potential short squeeze.
Disclaimer
This article is for informational purposes only and does not constitute financial advice. Cryptocurrency investments carry high volatility and risk. Market conditions can change rapidly due to macroeconomic and geopolitical factors. Readers should conduct independent research and consult financial advisors before making investment decisions related to digital assets.
Source Links