
Friday was a push-and-pull session for Strategy. The stock opened at $144.43 on 23 October 2026. It ranged between $144.21 and $152.2, then sat at $146.675 by 15:39 ET. That’s 0.6% above the previous close of $145.80. The session hadn’t finished at that point.
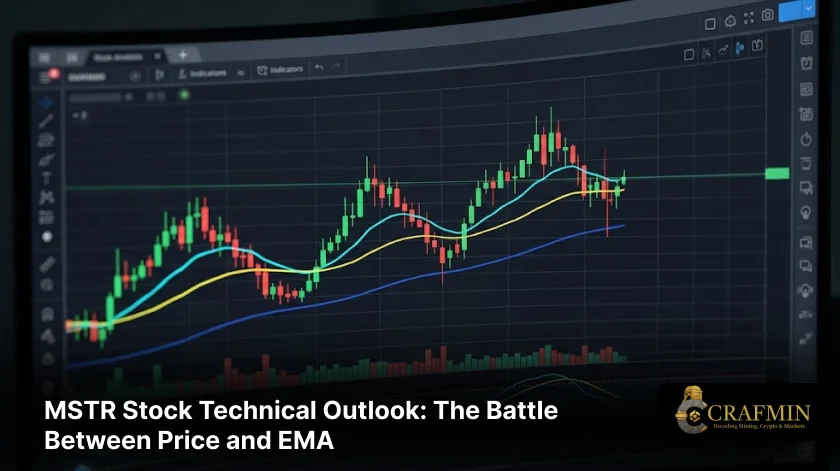
The standoff is simple. Price is under the 20-session exponential moving average (EMA) at $148.01. It’s still over the 50-session EMA at $140.52. Bulls want the first line back, and bears want the second broken. Neither camp has pulled it off.
So why do these lines matter? An EMA leans on recent prices, which makes it quicker than a plain average. Rallies tend to stall beneath the short-term line. Buyers usually keep defending above the longer one.
Why the Daily Chart Won’t Pick a Side
The daily numbers read like a coin toss. Here’s what’s on the screen:
- Price trades below the 20-session EMA at $148.01 and the 200-session EMA at $152.42.
- It holds above the 50-session EMA at $140.52, so the picture isn’t fully bearish.
- Daily RSI14 is 49.95, a whisker under the neutral 50 mark.
- The MACD line is positive at 0.66, but it trails its signal at 2.49.
- The MACD histogram is negative at -1.83.
- Daily ATR14 is $9.79, which tracks volatility rather than direction.
Bollinger Bands don’t settle things either. Price is under the mid-band at $151.72, with the lower band at $136.18 and the upper at $167.27. Nothing confirms bullish momentum, and nothing confirms a full breakdown. That’s the neutral daily read.
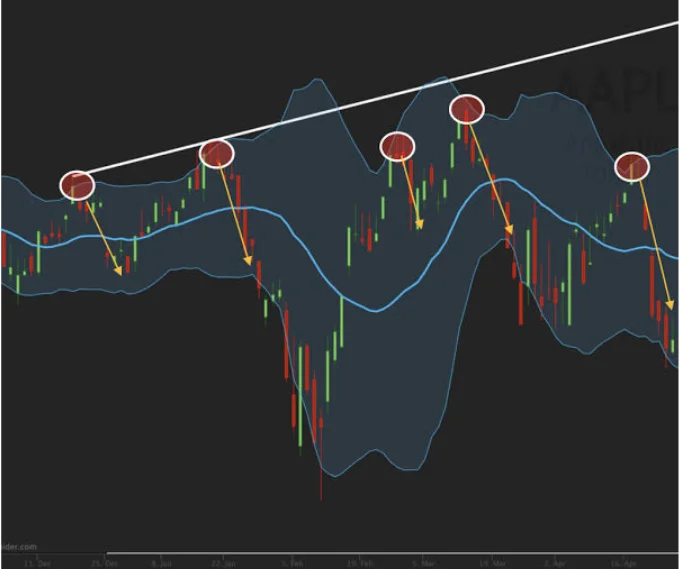
Daily Bollinger Bands frame a range of $136.18 to $167.27. [Trendspinder]
How the Hourly and 15-Minute Charts Add Caution
Shorter timeframes lean careful too. The key readings are below:
- Price is below the 20-hour EMA at $147.3 and the 50-hour EMA at $147.05.
- It holds above the 200-hour EMA at $146.52.
- Hourly RSI14 is 49.02, and the MACD line at 0.48 trails its signal at 0.74.
- The hourly MACD histogram is negative at -0.25.
- Hourly ATR14 eased to $2.91 from $3.11.
- On the 15-minute chart, price is just above the pivot at $146.64.
- Support is $146.29 and resistance is $146.98.
- The 15-minute RSI14 is 43.17, and the MACD line at -0.1 sits below its signal at 0.34.
- Price is below the 15-minute 20-period EMA at $148.16, 50-period EMA at $147.94 and 200-period EMA at $147.77.
Short-term averages are pressing down on price, and momentum is soft. The 15-minute view doesn’t confirm a bullish setup. Active traders might want a clean push through $147.3 first. Patience beats aggression here.
Where the Levels Sit in Any MSTR Stock Price Prediction
Any MSTR stock price prediction comes down to how price behaves at nearby markers. Two scenarios frame the debate:
- Bullish: price must clear the hourly 20-period EMA at $147.3 first.
- The daily 20-session EMA at $148.01 is the next hurdle.
- Acceptance above daily first resistance at $149 would strengthen the case.
- Beyond that sit the Bollinger mid-band at $151.72 and the 200-session EMA at $152.42.
- Bearish: a slip below the daily pivot at $146.2 weakens the bullish view.
- A break under first support at $143.01 would invalidate a near-term bullish reading.
- That would put the 50-session EMA at $140.52 in focus, with $136.18 next.
Treat these as a guide, not a guarantee. Each hold or break shifts the balance between buyers and sellers. Traders who respect the lines usually manage risk better than those who guess.
When Earnings Could Break the Deadlock
Company news may set the timing. Yahoo Finance reported on Wednesday that Strategy’s board lifted its securities buyback capacity to $3 billion. A Thursday report said earnings were due the following week. That puts the catalyst inside the coming days. Earnings often stir up volatility, and charts can’t say which way it breaks.
Volatility is already part of the story. Daily ATR14 is $9.79, while hourly ATR14 is a calmer $2.91. Keep the plan simple. $148.01 is the main test. Below that, $146.2 comes first, then $143.01. Lose that and $140.52 is next.
Also Read: ETH Price Recovery: How Ethereum’s Past Shapes Market Expectations
FAQs
Q1: Where is MSTR stock trading today?
A1: MSTR traded at $146.675 at 15:39 ET on 23 October 2026. That was up 0.6% on the previous close of $145.80.
Q2: What are the key levels in this MSTR stock EMA analysis?
A2: Resistance sits at the 20-session EMA of $148.01. Support sits at the 50-session EMA of $140.52.
Q3: What is the daily RSI reading for MSTR stock?
A3: Daily RSI14 is 49.95, just under the neutral 50 mark. That points to no clear momentum either way.
Q4: When does Strategy report earnings?
A4: A Thursday report said Strategy was due to report the following week. Its board also lifted buyback capacity to $3 billion.
Disclaimer:
This article is general information, not financial advice. The MSTR figures come from a Cryptonomist report dated 23 October 2026, and they will change. EMA, RSI and MACD readings can’t predict outcomes. Strategy shares are volatile, and earnings next week could widen swings. You could lose capital. Do your own research and consult a licensed adviser before any trading.
