

CryptoNews published its 11 September analysis when Bitcoin was trading at US$77,218.01. The report, attributed to The Cryptonomist, found that the price remained above three important daily averages. Recent trading was less reassuring.
Across the wider cryptocurrency market, values fell 2.31%. Bitcoin dominance stood at 58.15%.
The BTC price today figures left traders with a practical question: was Bitcoin taking a pause, or was a larger pullback beginning? The daily chart still supported the first possibility. Hourly trading gave reason to consider the second.
The figures in this article belong to that 11 September report. They are historical readings, quoted in US dollars.

Figure 1: Bitcoin illustration accompanying the 11 September 2026 market report [Courtesy: CryptoNews].
Above US$77,000, but Only Just
At the reported price, Bitcoin had cleared US$77,000 by a little over US$218. Further down, the 50-day and 200-day averages offered a different perspective. Both remained well below the quoted price, supporting the report’s view that the daily uptrend had survived.
That was the tension running through the analysis. Bitcoin had kept much of its earlier strength, but the latest trading offered less room for comfort.
The Daily Chart Still Favoured Buyers
A closer look at the daily readings shows why the report did not call the broader trend bearish.
| Daily Measure | Reported Reading |
| Bitcoin price | US$77,218.01 |
| 20-day EMA | US$77,018.30 |
| 50-day EMA | US$72,881.04 |
| 200-day EMA | US$72,271.40 |
| 14-period RSI | 54.87 |
Bitcoin remained above each average, and the shorter averages were above the longer ones.
The Relative Strength Index, or RSI, was also above its midpoint, at 54.87. The source described that reading as neutral to firm. It left room for buying to strengthen, without suggesting that a forceful recovery was already underway.
For Bitcoin price analysis, that distinction is useful. The daily figures supported the existing trend, but offered less evidence about whether the next move would extend it.
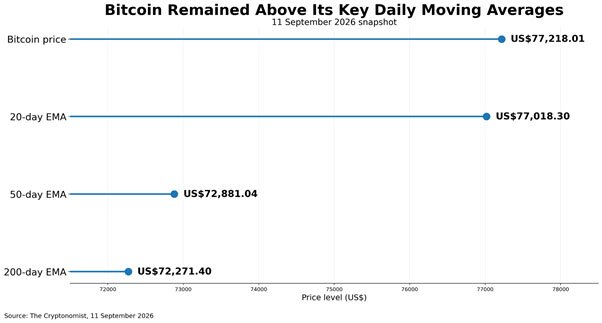
Figure 2: Bitcoin remained above its 20-day, 50-day and 200-day moving averages on 11 September 2026, keeping the broader daily trend constructive [Source: The Cryptonomist].
Sellers Had More Influence on the Hourly Chart
The picture changed when the analysis moved to Bitcoin hourly momentum.
| Hourly Measure | Reported Reading |
| Bitcoin price | US$77,200.48 |
| 20-period EMA | US$77,585.80 |
| 50-period EMA | US$77,749.40 |
| 200-period EMA | US$78,489.49 |
| 14-period RSI | 45.68 |
The arrangement was bearish, and hourly RSI at 45.68 reinforced the weaker assessment.
There was a small improvement in the hourly MACD histogram, which was positive at 37.60. The report saw a possible sign of stabilisation there. Still, price remained below every hourly average listed, leaving little basis to declare that the selling pressure had passed.
Sentiment Had Yet to Follow Prices Lower
The Fear & Greed Index remained in the Greed category at 56, even as the wider market fell.
That left crypto market sentiment looking more confident than the hourly chart. The report considered whether buyers would return to support the daily trend, or whether further selling would eventually shake that confidence.
Bitcoin’s market share added context. Dominance of 58.15% suggested that it was holding up comparatively well within the broader decline.
It did not, by itself, prove that new money was entering Bitcoin. The report instead pointed to the greater vulnerability of alternative cryptocurrencies while the overall market was contracting.
Crafmin’s earlier article on investor caution despite cooling inflation offers another example of sentiment and price performance failing to move together.
Exchange Fees Gave an Uneven Reading
- Fee data from decentralised exchanges also showed a mixed picture across the market.
- Uniswap V4 fees increased by double digits over 24 hours, pointing to stronger short-term activity on the platform.
- Curve fees fell sharply over seven days, although its 30-day performance remained firmly positive.
- The figures should not be compared too directly because they cover different time periods.
The Next Price Hurdles Were Already in View
The immediate Bitcoin support and resistance levels gave the analysis a more concrete focus.
| Level | Reported Price |
| Daily pivot | US$77,718.20 |
| Hourly 200-period EMA | US$78,489.49 |
| Daily Bollinger middle band | US$78,621.15 |
| Daily R1 resistance | US$79,389.81 |
| Daily Bollinger lower band | US$76,276.11 |
| Daily S1 support | US$75,546.39 |
On a recovery, the daily pivot was the first of these levels above the quoted price. A move through the Bollinger middle band would provide further evidence of returning momentum, according to the report.
Below price, the lower Bollinger Band and daily S1 were the main downside references. Sustained weakness through those areas would strengthen the argument for a deeper correction.
None of these outcomes had been confirmed in the snapshot.
What Would Make the Picture Clearer?
- The next few daily closes around the 20-day EMA and the key pivot level could provide a clearer indication of Bitcoin’s direction.
- At the quoted price, Bitcoin was already trading above the 20-day EMA. A move above this level and a return to US$77,718.20 would improve the buyers’ position.
- Today’s Average True Range (ATR) was 2,234.41, indicating the relatively wide trading ranges witnessed in recent times.
- The elevated ATR showed that volatility was still present, but not in which direction the next major move would be.
- The big question for the BTC price today was whether the broader daily uptrend could hold in the face of weaker momentum on the hourly chart.
FAQ
Q1. Is US$77,218.01 the current Bitcoin price?
No. It is the price recorded in the report dated 11 September 2026.
Q2. Why did the daily chart remain constructive?
Bitcoin was above its 20-day, 50-day and 200-day EMAs, with daily RSI at 54.87.
Q3. What weakened the hourly outlook?
The hourly price was below all three tracked EMAs. RSI was also below 50, at 45.68.
Q4. Was market sentiment fearful?
The reported Fear & Greed Index was 56, placing it in the Greed category.
Q5. Did the report predict a definite fall?
No. It discussed possible recoveries and declines, depending on subsequent price behaviour.
Read More: The Volatility Trap: How Leverage and Macro Forces Rocked the Crypto Market
Disclaimer
This article has been written for Crafmin solely for informational purposes and shall not constitute investment advice. The information is based on the referenced report of 11 September 2026. Readers are advised to check prices and data themselves before taking any investment decisions. Technical indicators and market scenarios are not indicators of future results. Cryptocurrency investments carry a risk of capital loss.