

Bitcoin is back in the spotlight as it retests a key resistance zone around $109,000. This level now marks a crucial threshold—determining whether Bitcoin’s price action trend reversal is genuine or if a crypto market correction looms large. Analysts are split: some predict a rally toward new highs, while others warn of volatility and short-term pullbacks.
Reclaiming $109K: Bullish Momentum Returns

After dipping to nearly $100K in late May, Bitcoin surged back, reclaiming the $105K–$106K range and pushing past the $109K resistance on Monday with a strong daily candle . As analyst Rekt Capital notes, BTC has retested the $104,400 re-accumulation range high, turning it into support and ending a two-week downtrend with a daily close above $110,500 .
Successfully flipping $109K from resistance into support would pave the way for Bitcoin to challenge its final daily resistance level near $111,723, which traditionally precedes a new all-time high.
RSI Divergence Sparks Pullback Concerns
Despite the optimistic narrative, warnings are emerging. Short-term RSI divergence near overbought territory hints at a potential reversal. CryptoTicker reports the Relative Strength Index nearing 67, and recent charts mirror a May false breakout above $109K—leading to a nearly 10% pullback .
CryptoNews.net adds that while momentum leans bullish, shrinking volume around $110K suggests profit-taking at psychological thresholds. They highlight the neutral zone between $107K and $110K, where the Awesome Oscillator (AO) signals underlying bullishness but MACD suggests weakening momentum.
Short-Term Scenarios: Breakout or Bull Trap?
THREE key scenarios are emerging:
- Bullish continuation: Sustaining above $109K and pushing through $111K could spark a fresh price discovery phase, especially if institutional inflows into ETFs remain strong .
- Bull trap and pullback: Failure to hold above $109K might send BTC back to the 38.2% Fibonacci retracement ($106.7K) or even deeper to $103K, echoing the pattern of false breakouts seen in May .
- Danger zone consolidation: Analyst “Altcoin Sherpa” warns that Bitcoin remains in a “dangerous area” near $110K. A drop could prompt a retest of major Bitcoin support levels between $102,770 and $106,090—where over 2.21 million addresses once held 1.39 million BTC .
Strategic Levels to Track
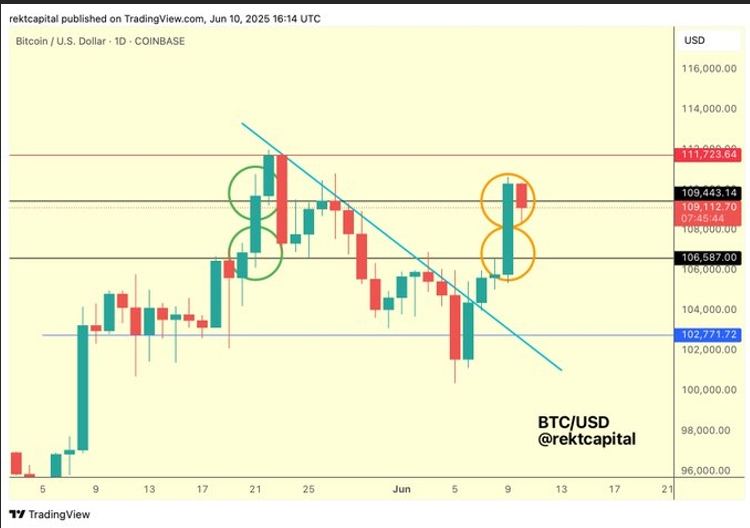
Bitcoin attempts to reclaim key resistance level. Source: Rekt Capital on X
- $109K–$111K: Zone where Bitcoin resistance zone may transition into support
- $104.4K: Retested accumulation support marked by Rekt Capital
- $106.7K: Fibonacci (38.2%) retracement level—watch for pullback on failed breakout
- $102.8K–$106.1K: High-supply zone with concentration of users, acting as a key Bitcoin support area
Analyst Outlook: From $120K to $140K Cycle Top
Crypto Jelle maintains that turning $108K into support could unlock Bitcoin’s next swing toward $120K, and eventually the $140K–$150K cycle top, reinforced by a potential inverse Head and Shoulders breakout .
Yet Altcoin Sherpa offers caution, still labeling Bitcoin’s position as precarious. Watching RSI and momentum metrics will be essential before declaring a definitive trend reversal or breakout.
Also Read:Michael Saylor Predicts Bitcoin Will Hit $1M, Dismisses Crypto Winter Concerns
Macro Tailwinds and Institutional Backing
Despite short-term volatility, strong institutional trends support a bullish backdrop:
- S. spot BTC ETFs recently drew nearly $935 million in net inflows and now manage over $104 billion in combined AUM .
- Positive developments like the U.S. Senate’s advancement of the Stablecoin Bill are instilling confidence in broader crypto asset infrastructure .
- Global ETF adoption signals rising market confidence and liquidity—setting up for Bitcoin to sustain a breakout with institutional fuel.
Conclusion: Watch This Space
Bitcoin’s retest of $109,000 resistance zone represents a pivotal moment. The asset is positioned at a crossroads: a confirmed breakout could reignite a new bullish phase toward $120,000 and beyond; failure may trigger classic pullbacks to support levels like $106K or even $104K.
Traders should monitor:
- Volume consistency above $109K–$110K
- RSI and MACD for overbought signals or divergence
- Strength of ETF inflows and stablecoin framework momentum
As of writing, BTC trades around $109.995K, up 3.6% weekly, reflecting cautious optimism.