

The price is flat. Sentiment is shot. And the broader market has little interest in altcoins right now. None of that is great for SOL. But strip away the noise and the on-chain picture looks different. Activity is picking up inside Solana’s ecosystem, quietly, without the price reflecting it yet.
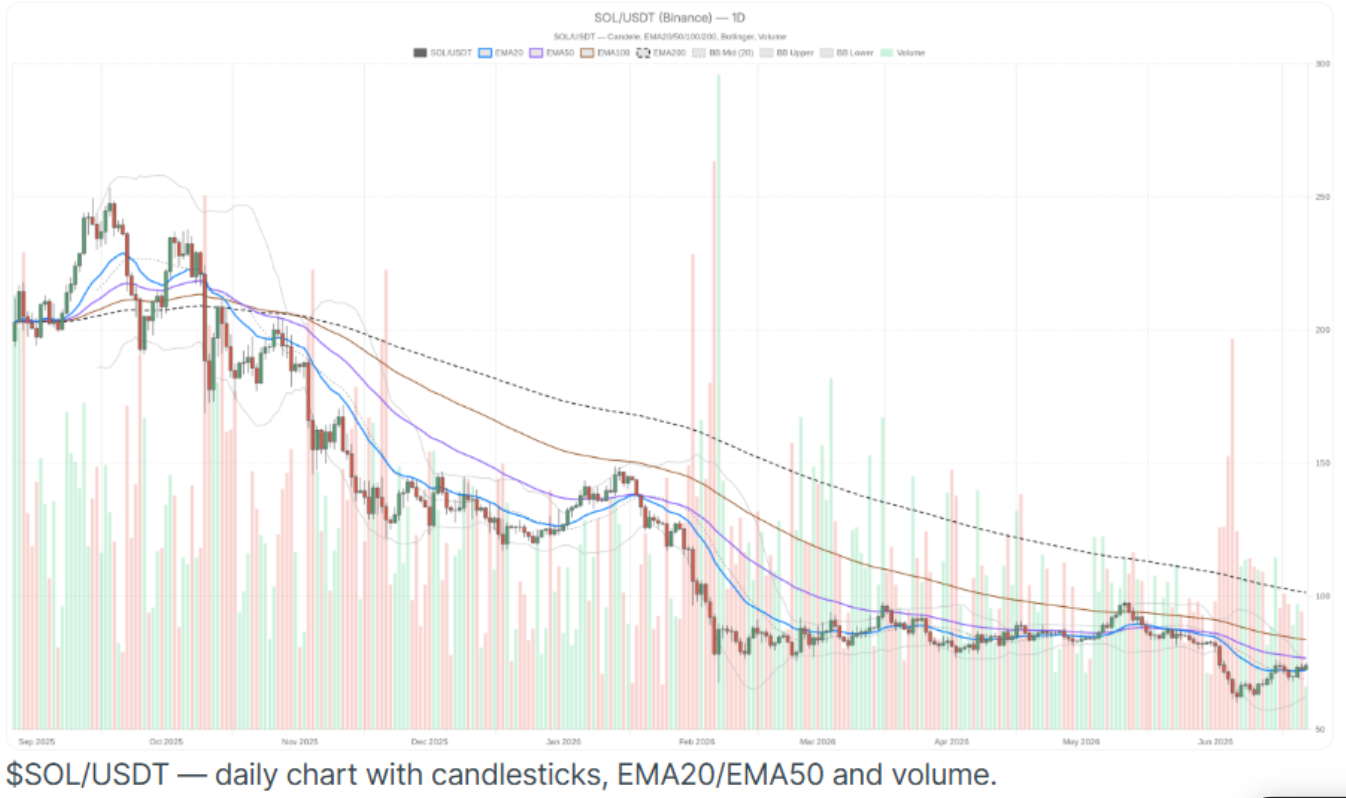 Figure 1: $SOL/USDT daily chart with candlesticks, EMA20/EMA50 and volume. [Binance via Cryptonomist]
SOL Trades at a Tense Crossroads
SOL closed at US$74.10 on 22 Jun 2026, right on its daily pivot. Boring number. Less boring context.
The EMA20 sits just below at US$72.23. The EMA50 hovers above at US$76.81. SOL is sandwiched between the two, and neither side has blinked yet.
What the Daily Chart Actually Says
The daily regime is neutral. SOL spent a stretch of time below the EMA20 and has only recently reclaimed it. That recovery is real, but it is not convincing yet.
The daily RSI sits at 51.61, just barely in buyers’ territory. There is no momentum conviction here. The MACD line is still negative at -1.57, but the histogram has registered 1.19 in positive territory. That narrowing gap is an initial hammer to short sellers that the downtrend is running out of steam.
The Hourly Picture Is Cleaner
The one-hour chart is a different conversation. SOL sits above its EMA20, EMA50 and EMA200, all stacked in order. Short-term traders have something to work with here. The daily is messy; the hourly is not.
The hourly RSI at 56.32 is mildly bullish without being stretched. There is room to run before hitting resistance.
 Figure 2: Solana (SOL) token, the native cryptocurrency of the Solana blockchain network.
The Zone That Defines Everything
The US$72.23 to US$76.81 band is the range that matters most right now. A clean break above US$76.81 would flip the daily regime from neutral to bullish. A daily close back below US$72.23 resets the recovery entirely.
Those are the only two levels that matter for the next 48 to 72 hours.
Raydium’s Fee Surge Is Not Noise
Here is the detail that separates this setup from a standard sideways chart. Raydium AMM, Solana’s flagship decentralised exchange protocol, recorded a 166.6% jump in seven-day fees as of 22 Jun 2026. Single-day fees also rose 25.6%. Meteora DLMM added a 29.3% daily fee gain on top of that.
When Raydium’s fee generation spikes that sharply over a week, it means DEX trading volume on Solana is surging. That kind of on-chain activity has historically preceded or accompanied price momentum in SOL itself.
 Figure 3: Crypto market trading activity amid shifting sentiment in 2026. [Magnific]
Price has not reflected this yet. That gap between ecosystem activity and token price is either an opportunity or a head-fake. The next few sessions will answer that.
On-Chain Activity and What It Means for Retail Traders
Most retail traders watch the price. The on-chain data watches something else entirely.
When Raydium’s seven-day fees jump 166.6%, it means real users are moving real money through Solana’s DEX ecosystem. That is not a price signal. It is a usage signal. And usage signals tend to show up before price signals do.
For retail traders, that gap matters. By the time SOL’s price reflects the activity surge, the easy part of the move is usually already gone. Watching fee data on protocols like Raydium and Meteora gives a few sessions of lead time that the candlestick chart simply does not offer.
The caveat is straightforward. On-chain activity rising does not guarantee price follows. It raises the probability. In a market sitting at Extreme Fear with Bitcoin dominance above 56%, probability and outcome are two different things. Retail traders who understand that distinction will size positions accordingly.
Fear and Greed Is Weighing on the Market
Fear and Greed at 20. Bitcoin dominance at 56.2%. Neither of those numbers is friendly to altcoins. The ecosystem data for Solana is improving, but the macro is not cooperating. That tension is the whole story right now. SOL needs the macro to stabilise before its on-chain momentum can translate into sustained price gains.
The Bullish and Bearish Cases
Bull case: SOL clears US$74.78, pushes through the US$76.36 to US$76.81 cluster with real volume, and targets US$79 to US$81. This ecosystem would suffice to back that momentum behind fee as far Raydium is concerned.
Bear case: the hourly breaks under US$73.69, the daily loses US$72.23, and the next stop is US$69.03. Below that, US$61.70 comes back into view. Not the base case, but not impossible either if sentiment keeps sliding.
Industry Outlook
The SOL crypto market analysis picture sits within a broader crypto market that is still finding its footing in 2026. Global interest in decentralised finance continues to grow, with DEX volumes across major chains rising steadily.
Solana’s low transaction costs and high throughput keep it competitive against Ethereum for DeFi activity, and the Raydium fee data suggests that positioning is holding.
Future Direction and Impact on SOL Price Outlook
The Solana price prediction 2026 narrative hinges on two things resolving in the same direction at the same time. The on-chain fundamentals need to hold, and the macro sentiment needs to shift out of Extreme Fear.
If Bitcoin stabilises above US$65,000, altcoin flows are likely to follow. SOL, with its improving DeFi metrics and tightening Bollinger Band compression on the hourly chart, would be well placed to catch that rotation early. Solana DeFi growth 2026 remains a credible thesis. Now it just needs permission from the market to be price.
FAQ
Q1. What is Solana’s current price as of June 2026?
Ans. SOL was at US$74.10 on 22 Jun 2026, just above the EMA20 at US$72.23. That level is the one to watch.
Q2. What is the key resistance level for Solana right now?
Ans. US$76.36 to US$76.81. That is the ceiling. A daily close above it changes the entire picture from neutral to bullish.
Q3. Why is Raydium’s fee surge significant for the Solana price prediction 2026?
Ans. A 166.6% jump in seven-day fees means people are actually using the network. That kind of volume spike on Raydium has shown up before SOL price moves before. It is not a guarantee, but it is not nothing either.
Q4. What is the Fear and Greed Index reading for crypto in June 2026?
Ans. 20. That is Extreme Fear. Nobody is taking big swings right now, and altcoins like SOL feel that the most.
Q5. What is the downside risk for SOL if sentiment worsens?
Ans. Lose US$72.23 and US$69.03 comes next. After that, US$61.70 is back on the table. Not the likely outcome, but worth knowing before sizing a position.
Disclaimer
This article is for informational purposes only. All data published in this content is sourced from publicly available external sources. Kindly verify all information related to cryptocurrency prices and market data independently. Any investment decision should be made at the investor’s own risk. Crafmin does not hold any position in the above-mentioned asset.