

Crypto corrections often trigger fear across digital asset markets. However, market data and expert analysis show that most pullbacks reflect routine cycles rather than structural failure. Analysts explain that crypto corrections follow clear mathematical and historical patterns. While prices may fall sharply in the short term, these movements often reflect volatility rather than collapse.
Recent price swings in Bitcoin and Ethereum have renewed debate over whether the market faces another crash. Yet long-term data suggest otherwise. Market participants now distinguish between corrections and crashes using defined metrics and historical benchmarks.
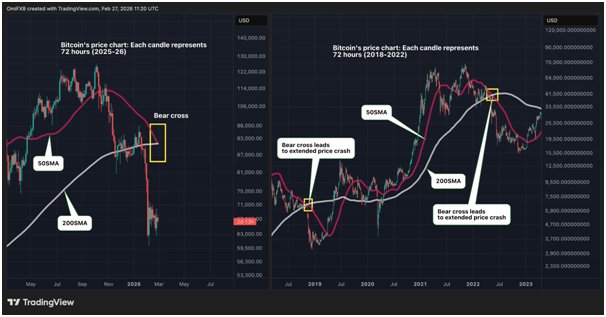
Crafmin analysis shows how Bitcoin and Ethereum corrections often signal upcoming recovery cycles. [CoinDesk]
Understanding Crypto Corrections vs Market Crashes
Financial markets classify a correction as a decline of roughly 10% to 20% from recent highs. A crash typically involves a drop greater than 20% within a short period. In crypto markets, volatility often compresses those timelines.
Institutional figures have addressed this distinction. John D’Agostino of Coinbase describes corrections as “mean reversion” in scarce assets. He explains that strong rallies cannot continue indefinitely. Markets eventually pull back to rebalance supply and demand.

John D’Agostino the Head of Strategy for Coinbase Institutional. [Wikipedia]
Michael Saylor of MicroStrategy has also highlighted historical drawdowns. He notes that leading technology assets often endure declines of 40% or more during growth cycles. These pullbacks do not signal failure. Instead, they reflect normal consolidation.
Bitcoin Historical Data Shows Repeated Recovery Cycles
Historical data from Bitcoin supports this pattern. During the 2017–2018 bear market, Bitcoin fell approximately 83% from its peak near $19,700 to around $3,200. The asset later recovered and reached new highs in subsequent cycles.
In 2021, Bitcoin experienced a mid-cycle correction of nearly 48% between April and July. The price recovered within months and later reached a record of nearly $69,000. The 2021–2022 downturn saw a decline of roughly 74% amid macroeconomic tightening and sector failures.
Current drawdowns remain milder than previous cycles. Analysts note that recent pullbacks of around 20% to 30% align more closely with standard corrections. Historical comparisons show that deeper crashes often exceeded 70%. Each cycle has produced lower peak-to-trough percentages, reflecting maturing liquidity.
View this post on Instagram
Ethereum and Broader Market Volatility Patterns
Ethereum has followed similar patterns. After reaching record highs in 2021, Ethereum declined more than 60% during the broader market downturn. However, the network continued development activity during that period.
Crypto markets operate 24 hours a day. This structure amplifies volatility compared to traditional equities. Unlike stock exchanges, crypto platforms do not halt trading during sharp price swings. As a result, prices adjust rapidly when sentiment shifts.
Liquidity also plays a role. Many digital asset markets maintain thinner order books than traditional financial markets. Even moderate trades can move prices significantly. This dynamic often magnifies short-term corrections.
Leverage, Sentiment and Market Mechanics
Leverage increases volatility in crypto corrections. Traders frequently use derivatives and margin positions. When prices fall, automated liquidations trigger additional selling. This creates cascade effects that deepen declines.
Sentiment also accelerates movements. News headlines, social media discussions, and macroeconomic events influence demand. Rapid shifts in confidence can lead to strong rallies or steep pullbacks within hours.
However, market mathematics limits sustained exponential growth. After extended rallies, profit-taking increases. Supply rises as early investors lock in gains. This natural rebalancing leads to corrections. Analysts describe this process as cyclical rather than catastrophic.
Past Market Shocks and Recovery Evidence
Major shocks have tested the crypto market before. The March 2020 pandemic selloff pushed Bitcoin toward $4,000. Within months, the asset recovered and later reached record highs.
The 2022 collapse of FTX triggered a broad downturn. Bitcoin fell near $16,000 during that period. Despite that shock, prices eventually stabilized and rebounded as market confidence returned.
These episodes show that external failures can cause crashes. Yet even severe downturns did not eliminate long-term growth trends. Historical rebounds followed each major disruption. Analysts point to these recoveries as evidence of structural resilience.
Corrections as Market Reset Mechanisms
Corrections often remove excessive speculation from the market. When prices rise rapidly, leverage and short-term trading increase. A pullback reduces overheated conditions and restores balance.
Long-term holders frequently accumulate during downturns. Blockchain data has shown increased wallet accumulation during past corrections. This behavior reflects investor confidence in long-term fundamentals.
Institutional analysts describe these phases as necessary resets. They argue that corrections improve sustainability by reducing leverage and stabilizing demand. Over time, this pattern has supported renewed upward momentum in previous cycles.
Also Read: Why Bitcoin Is Slumping: Jane Street Conspiracy Explained – Bitcoin Slumping Reasons
Current Market Context and Long-Term Outlook
Recent volatility has raised concerns among retail investors. However, analysts stress that current drawdowns align with historical correction ranges. Price movements of 20% to 30% remain common in crypto bull markets.
Bitcoin adoption metrics and network activity continue to show steady participation. Ethereum development and decentralized finance activity also remain active. These fundamentals provide context beyond short-term price swings.
Market history shows that crypto corrections occur regularly. Mathematical rebalancing, liquidity dynamics, and investor behavior drive these moves. While prices fluctuate sharply, data indicate that corrections represent normal cycle behavior rather than systemic collapse.
Investors continue to monitor macroeconomic factors, including interest rates and regulatory developments. Short-term volatility may persist. Yet historical precedent suggests that crypto markets often recover from corrections and resume broader growth trends.
In conclusion, crypto corrections reflect simple market mechanics. They follow supply-demand adjustments and leverage resets. Historical data from Bitcoin and Ethereum demonstrates repeated recovery cycles. Analysts, therefore, view current pullbacks as part of a familiar pattern. As markets mature, volatility may moderate further. For now, price corrections remain a defined feature of the digital asset landscape rather than evidence of an irreversible crash.