
")
The Australian crypto market industry is at an important crossroads this month. Investors across the nation are watching the charts with intense focus.
Bitcoin currently sits at a major technical crossroads. The asset is teasing a move that will define the winter of 2026.
Local market participants want to know if this consolidation will spark a rally. Let us analyse the charts to find the true answer.
The Current Technical Grid
The current price of Bitcoin on the 4-hour chart is precisely $65,581.20. This particular price shows that there is a struggle occurring between buyers and sellers.
The market displays indecision at this specific level. A fragile short-term uptrend is fighting a dominant long-term downtrend.
Buyers have successfully built a floor of higher lows since June 5. That supportive floor started down at the $59,159 mark.
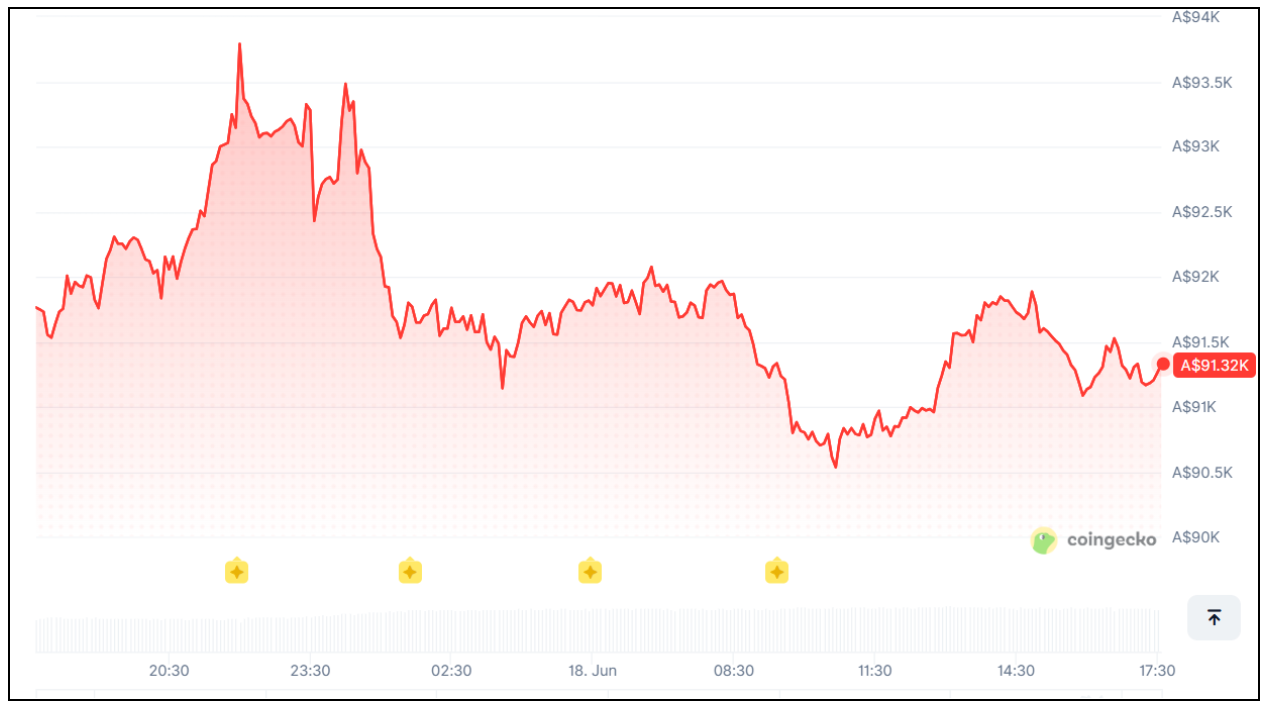 Fig 1: Bitcoin price 24 hrs chart [Coingecko]
A SuperTrend bullish signal also offers solid support at $64,476.14. This specific signal keeps hope alive for optimistic Australian buyers.
However, the bears still hold the long-term steering wheel. The price remains well below the 200-period moving average of $70,215.87.
This heavy moving average proves that sellers dominate the bigger picture. We need a surge to shift this negative narrative.
Bitcoin Breakout Analysis
Right now, the price sits directly inside the Ichimoku Kumo cloud. The cloud spans from $63,993 to $65,979.
This technical layout creates mixed signals for traditional trading strategies. Our bitcoin breakout analysis reveals a tough stalemate inside this zone.
The range between $64,500 and $66,500 acts as a dangerous trap. Disciplined traders categorise this area as a strict no-trade zone.
Heavy chop in this specific area eats up retail capital very quickly. Both buyers and sellers suffer losses when they guess direction here.
Furthermore, trading volume has declined on the recent push upward. This clear drop shows that buyers are running out of steam.
Without expanding volume, a breakout cannot sustain its upward trajectory. We must wait for institutional volume to flood the market.
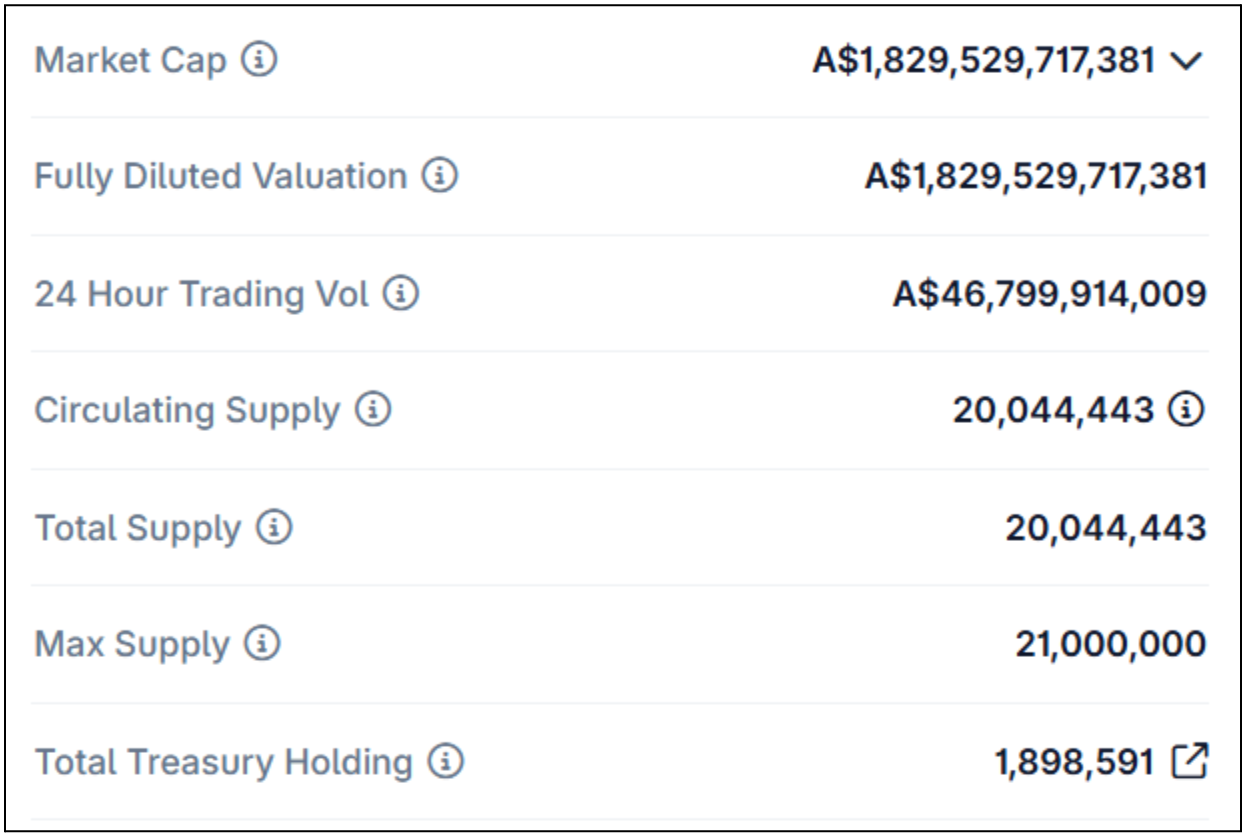 Fig 2: Bitcoin facts [Coingecko]
Deciphering the Ichimoku Kumo Mechanics
The Ichimoku cloud represents a thick zone of historical support and resistance. It filters out the noise of short-term price fluctuations.
When price action enters the cloud, volatility often increases. The borders of the cloud create immediate friction for any price movement.
Aussie analysts know that trading inside the cloud brings random results. The asset can bounce unpredictably between the upper and lower boundaries.
Currently, the upper boundary sits right near the $66,000 level. This proximity makes the $66K resistance a critical line to watch.
A clean daily close above the cloud changes market psychology. It signals that buyers have finally overwhelmed the passive sell orders.
The $66K Resistance and the Bull Run Trigger
The $66,000 level represents a psychological barrier for local investors. Sellers have defended the broader resistance near $67,000 twice recently.
These strong bearish rejection candles show heavy sell orders at that ceiling. Traders can expect a fast move higher if bulls smash through this wall.
A clean breakout above $67,300 will accelerate bullish momentum quickly. This breakout will trigger a wave of short covering.
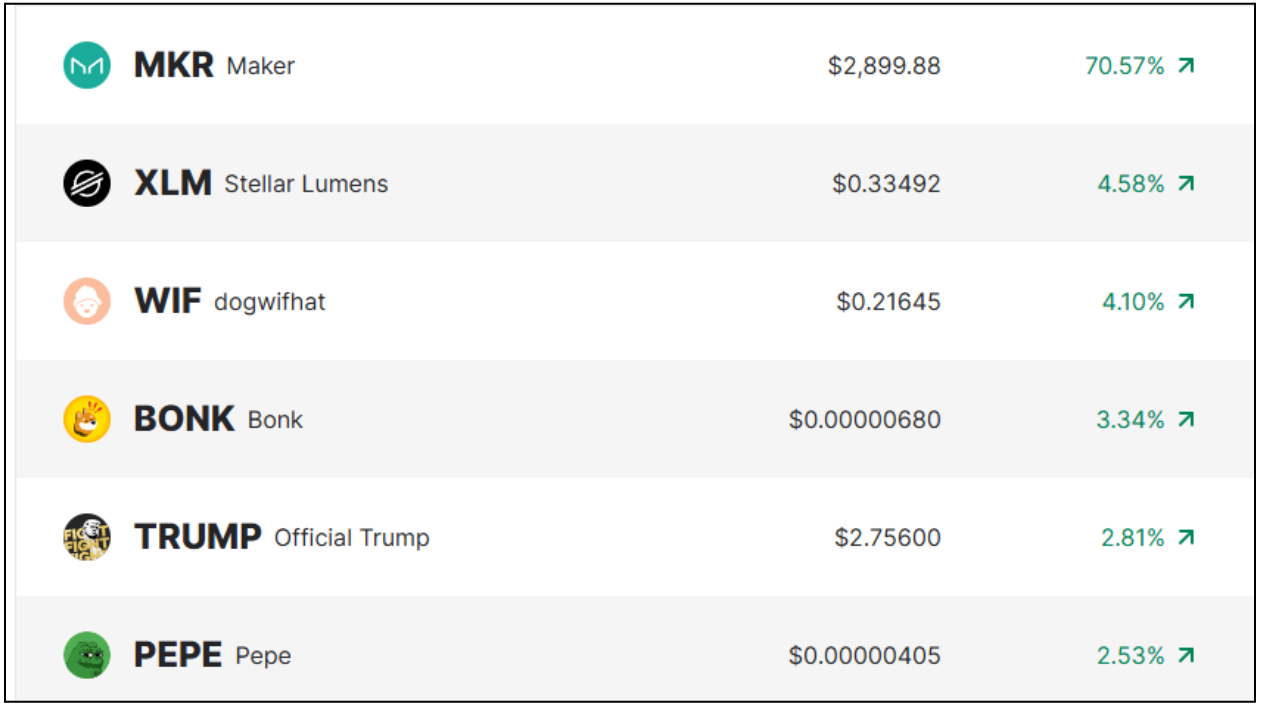 Fig 3: Alternative coins price list [bitcoin.com.au]
Traders will then target the next major overhead levels with high confidence. The first upside target sits at $66,968 for conservative entries.
The second bullish target rests at $67,276. A momentum surge could push the asset toward $69,000 very quickly.
That $69,000 target offers an excellent risk-to-reward ratio of 3.5. Patient traders are waiting for this exact trigger to buy.
Bearish Breakdown Risks to Watch
We cannot ignore the bearish potential in this volatile environment. The bears want to reclaim total control of the price action.
A strong bounce at the $64,000 to $64,500 confluence is absolutely vital. This zone combines the SuperTrend and the 50 moving average.
This specific area represents the ultimate line in the sand for buyers. A clean breakdown below this floor will change the game.
A 4-hour candle close below $64,000 will signal a severe breakdown. Sellers will regain total control of the market immediately.
This breakdown will open the door to much lower technical targets. The first bearish target sits at $62,836.
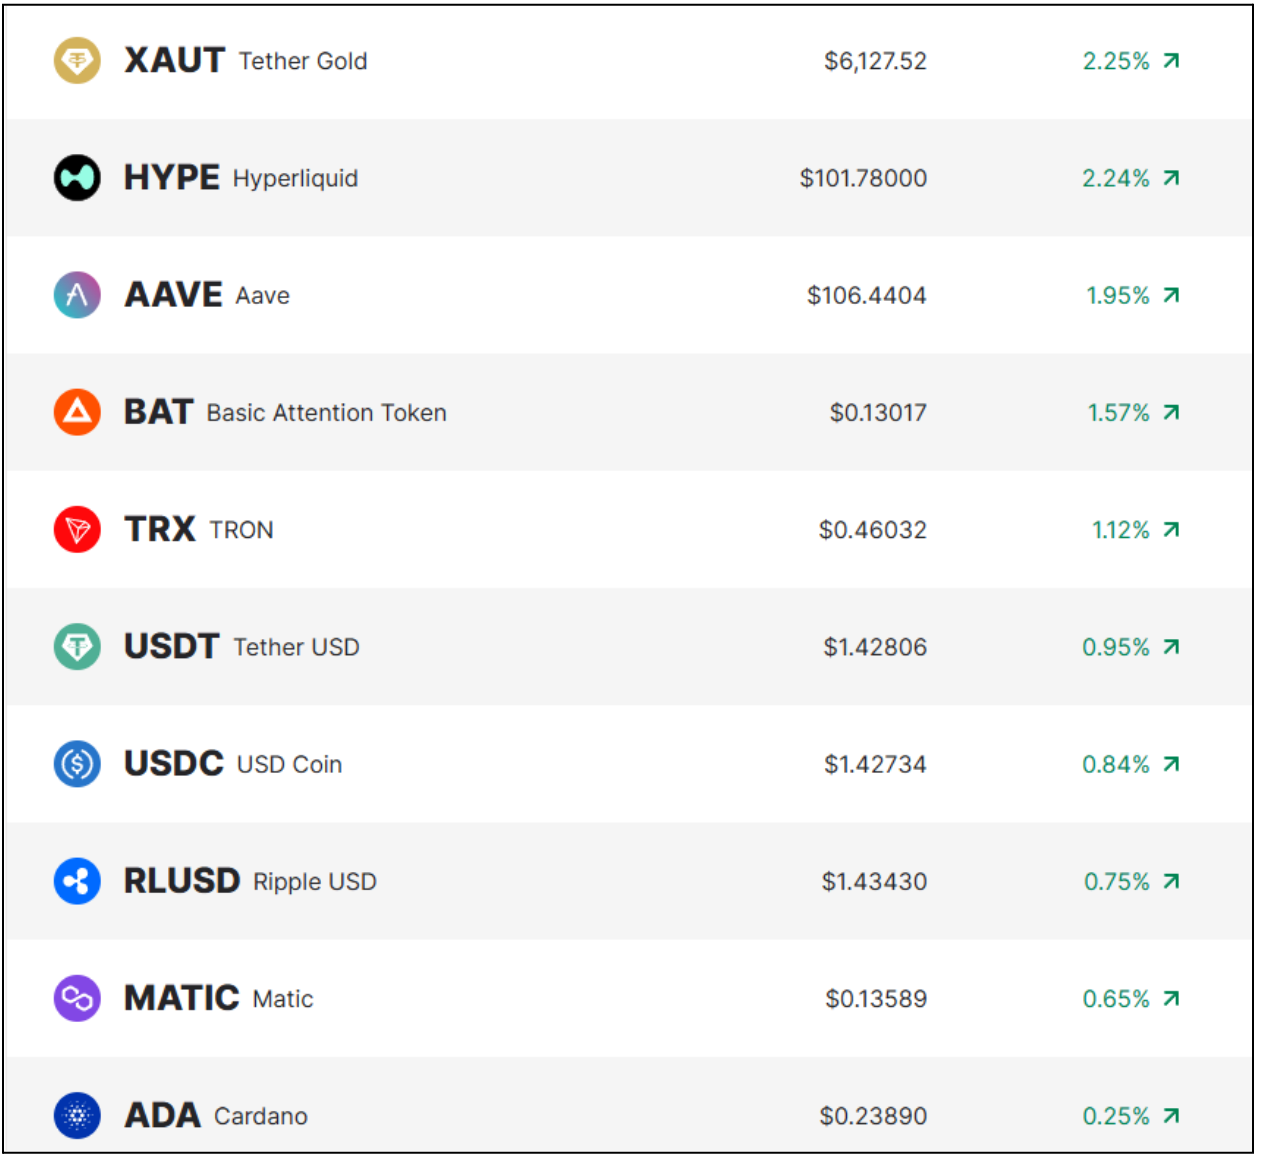 Fig 3: Alternative coins price list [bitcoin.com.au]
The next major support level rests down at $60,800. That downside target delivers a high risk-to-reward ratio of 8.25.
Reactive traders prefer this short scenario because they expect sharp flushes. However, everyone must watch for dangerous bear trap reversals.
The Psychology of the Whipsaw Zone
Traders often lose their entire balance during periods of consolidation. The desire to trade every minor move destroys profit margins.
Aussie investors must resist the urge to overtrade inside this range. The market is merely collecting liquidity before a major expansion.
Failing to wait for confirmation leads to emotional distress. Successful funds always wait for the market to reveal its hand.
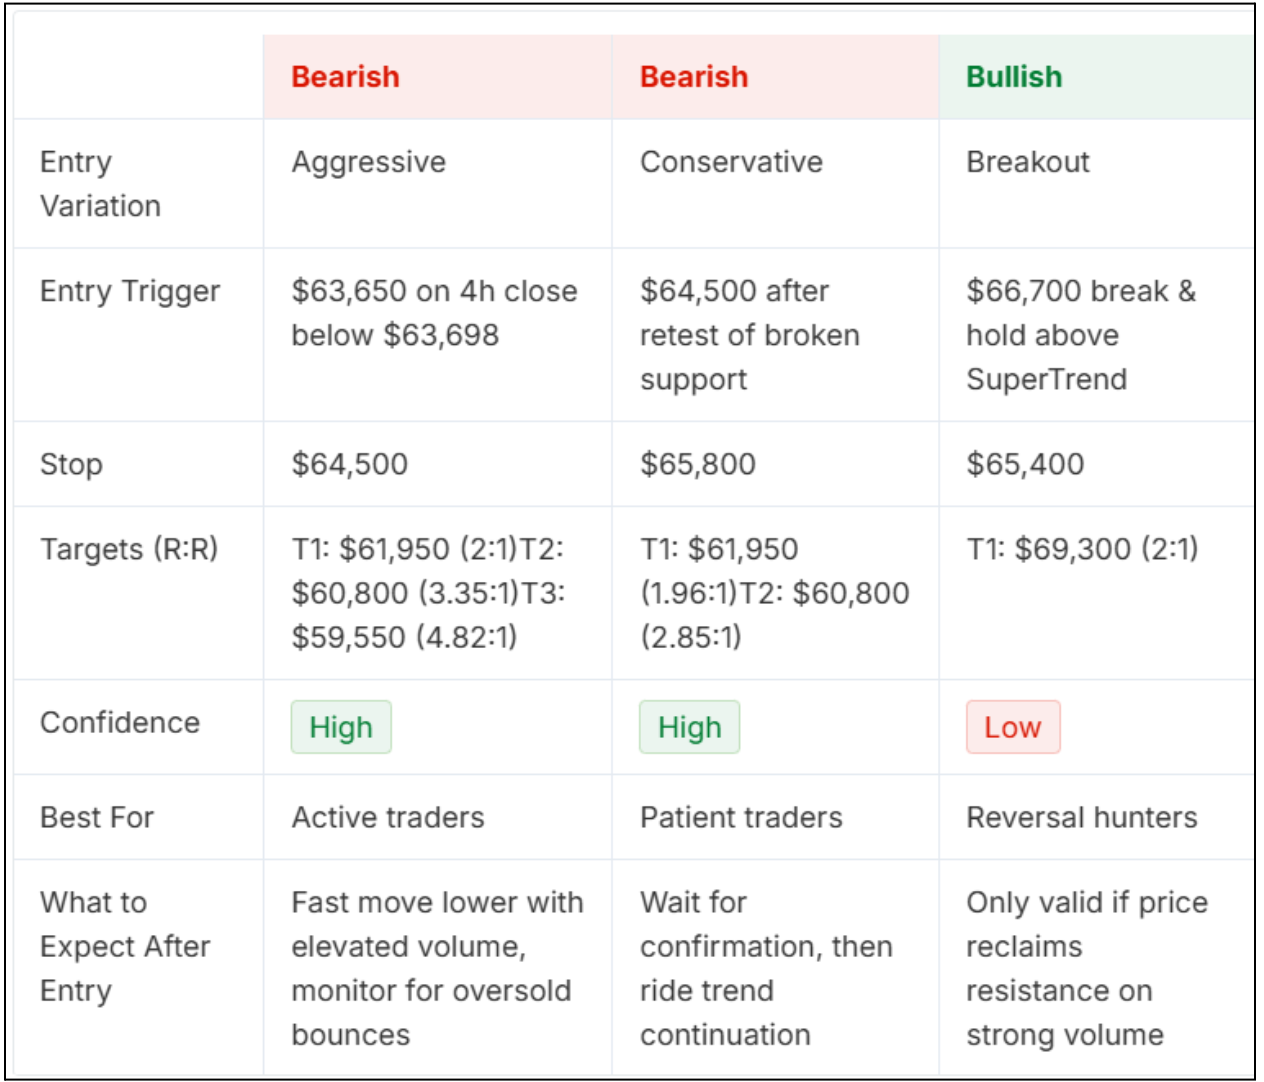 Fig 4: Trade Scenarios Table [au.investing.com]
Right now, the market shows structural equilibrium between both sides. Neither the bulls nor the bears have established clear dominance.
Accepting a neutral stance preserves your psychological capital for the real trend. Professional execution requires extreme emotional control during dull phases.
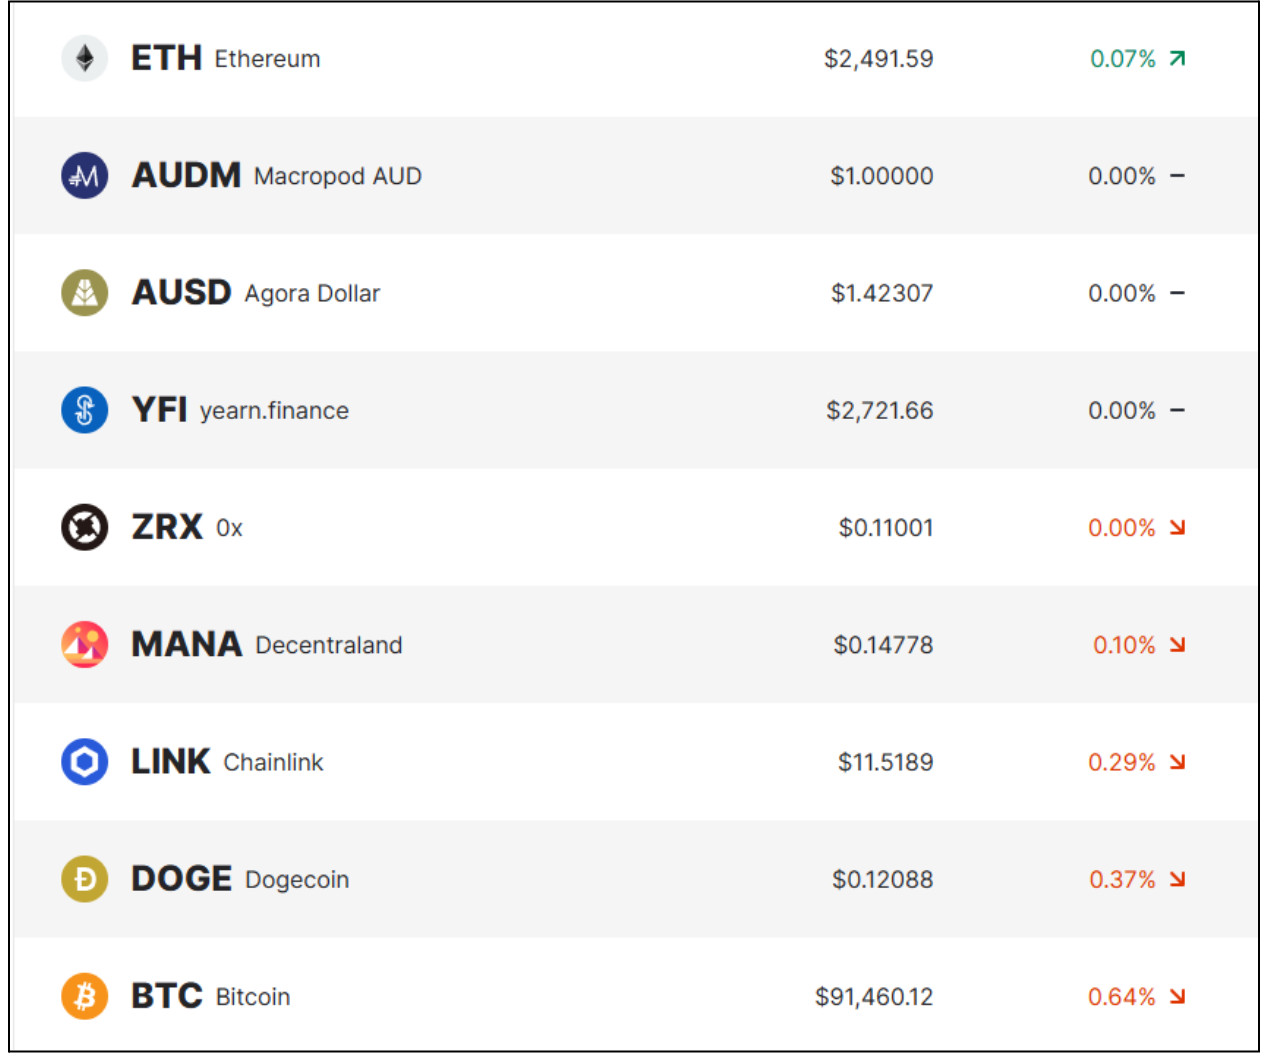 Fig 5: Digital coins price chart [bitcoin.com.au]
The Macro Outlook
This current chart battle heavily influences our long-term bitcoin price prediction 2026. The next directional move will set the tone for months.
If bulls clear the 200-period moving average, the macro outlook brightens. We could see a sustained run into late 2026.
Many macroeconomic factors favour a positive shift in digital assets this year. Australian institutional adoption continues to grow at a steady pace.
However, the technical charts must confirm the fundamental narrative first. A failure to clear the cloud will delay the macro bull run.
Our BTC price outlook 2026 remains cautious but opportunistic. We track these live levels to manage our investment capital safely.
The bullish thesis fails completely if the price closes below $62,836. Conversely, the bearish thesis dies if the price breaks above $67,300.
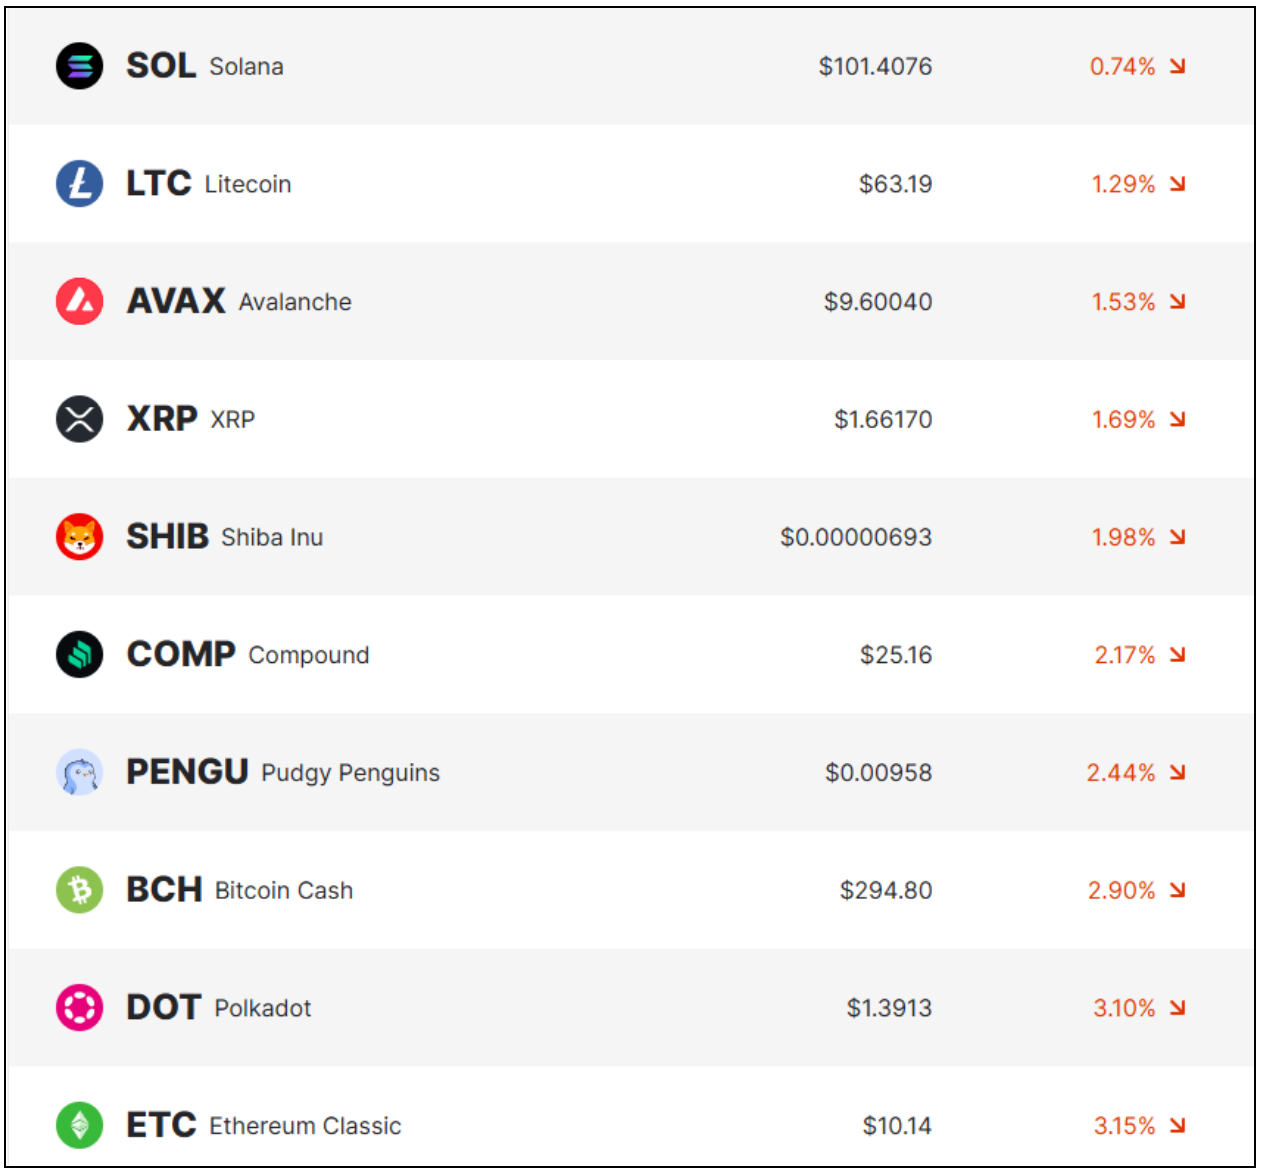 Fig 6: Digital coins price chart [bitcoin.com.au]
Execution Strategies and Risk Radar
- Heavy volatility requires flawless risk management from every Australian trader. The Average True Range currently sits at $876.
- This indicator means you must expect $800 to $900 swings per session. Your position sizes must reflect this volatility.
- We omit forceful entries entirely due to poor risk-to-reward ratios. Choppy conditions make plays far too dangerous today.
- A conservative long entry requires a solid bounce from the $64,000 level. Set your stop loss at $63,600 to protect your capital.
- Expect a slow grind if you enter a long position here. Move your stop to breakeven at the first target.
- You should trail your stop loss after the price hits target two. This technique locks in profits during a sudden reversal.
- A conservative short entry triggers after a 4-hour close below $64,000. Place your stop loss at $64,500 for safety.
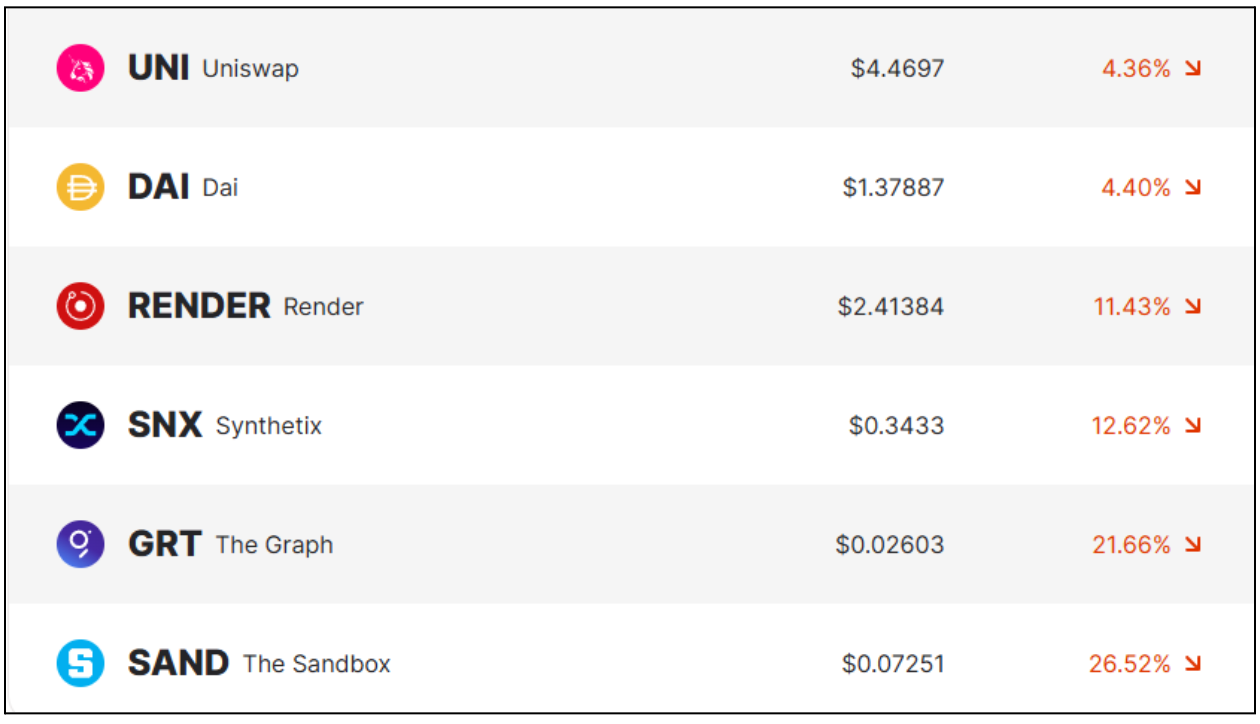 Fig 7: Digital coins price chart [bitcoin.com.au]
Advanced Timeframe Analysis
Experienced market players use platforms like InvestingPro+ to run this analysis. They have employed the use of additional credits to look into lower time frames such as the 15-minute time frame.
Study the 5-minute and 30-minute time frames for early trends. Breakouts often happen first on the 1-minute chart and then expand to higher time frames. Tracking these fast charts helps you spot early institutional accumulation.
However, you must always look back at the 4-hour chart for macro confirmation. Short-term charts often produce false signals during choppy weeks.
Combining multiple timeframes ensures you do not fall for simple market traps. This analytical rigor separates top professionals from retail gamblers.
Also read: Australia’s Crypto Future: Why Trust Will Define Mainstream Finance by 2030
FAQ
- What does the current Bitcoin chart indicate for traders?
- The 4-hour Bitcoin chart provides a true masterclass in market indecision. Australian investors must exercise extreme patience to gain a strategic edge right now.
- Is it safe to trade during this period of consolidation?
- Standing aside is a genuine trading position in a choppy market. Capital preservation always beats a forced trade during periods of low volume.
- Which key price levels should investors watch this week?
- Traders must watch the $64,000 to $67,300 range with strict discipline. The eventual breakout from this technical cloud will be truly explosive.
- How should market participants prepare for the next big move?
- Prepare your capital and watch the key entry triggers closely. The next major bull run waits for this crucial technical confirmation.
Also read: Next Bitcoin Price Prediction 2026 and Crypto Market Outlook
Disclaimer
This article is meant only for informational purposes. If you are an investor who is watching crypto market closely, all the data published in the content is sourced from announcements and external sources. Kindly verify all information related to the share price and market data. Any investment should be made at the investor’s own risk. Crafmin does not hold any position in the above-mentioned Company.
——————–
Source: