

The Bitcoin price tagged a 12-week high of USD 79,399 overnight before sellers stepped in hard during Asian morning hours, reversing what had briefly looked like a clean run toward USD 80,000 for the first time since January.
By Monday morning, Bitcoin was trading at around USD 77,705, down 0.4% over 24 hours after climbing to the USD 79,399 mark around 09:00 IST and pulling back sharply through the Asia session.
It was the latest in a growing list of near misses for the world’s largest cryptocurrency.
What Drove Bitcoin Price Higher in the First Place
The weekend rally had a clear trigger: fresh diplomatic signals out of the Middle East.
Asian shares moved higher on Monday following a report from Axios that Iran had offered a new proposal to the United States to reopen the Strait of Hormuz, the critical shipping corridor that handles a significant share of global oil flows.
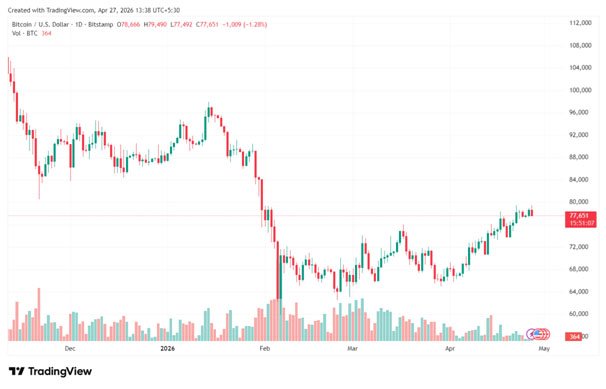
Bitcoin price action in April 2026, showing the rally to a 12-week high near USD 79,400 and the reversal during Asian trading on 27 April.
Markets read it as a risk-on signal. Bitcoin, which has proved more sensitive to Iran-related headlines than most traditional assets over recent weeks, caught a bid.
An earlier version of this pattern played out on 18 April, when Bitcoin surged above USD 78,000 in a sharp short squeeze after Iran declared the Hormuz fully open and Donald Trump claimed Tehran agreed to an unlimited suspension of its nuclear programme. That rally triggered roughly USD 762 million in crypto liquidations, with short sellers taking the brunt.
This time around, the surge was more measured. But sellers were already waiting.
Why USD 79,000 to USD 80,000 Keeps Acting as a Ceiling
This was Bitcoin’s third failed attempt to clear the USD 79,000 level in eight sessions. Analysts say the USD 80,000 area is a key breakeven zone for recent buyers, which creates selling pressure even as Bitcoin is up 16% in April and seeing strong institutional accumulation.
Think of it this way: anyone who bought Bitcoin near USD 79,000 to USD 80,000 during earlier failed breakout attempts is sitting on a loss. The moment price climbs back into that zone, they sell to get out flat. That turns a resistance level into something closer to a ceiling of trapped capital.
Chart analysis from Crypto Patel confirms BTC price reclaimed the USD 79,425 level after several months below it, which signals short-term structure has improved – but improvement in structure alone is not the same as a sustained breakout.
The selling pressure at USD 79,400 is real. Getting through it will need something bigger than a weekend headline.
What’s Different This Time: Institutional Demand Is Quietly Building
Despite the repeated failures at resistance, the underlying demand story has changed meaningfully since February.
Spot Bitcoin ETFs attracted USD 996 million in net inflows over the previous week, their most impressive week since January, with Friday alone recording USD 663.9 million entering the funds.
That is not retail FOMO. That is institutional capital being deployed steadily, not loudly.
Bernstein maintains a USD 150,000 year-end 2026 target backed in part by MicroStrategy’s purchase of 4,871 BTC for USD 329.9 million between 1 April and 5 April, right into the conflict’s worst week. Long-term holders are buying the fear.
Negative funding rates across Bitcoin perpetual futures are another signal worth watching. Funding rates in perpetual futures remain negative, signalling that short positioning is still elevated. That leaves room for another squeeze if prices hold above key support levels.
In simple terms, there are a lot of bets against Bitcoin right now. If a real catalyst arrives, those short positions become rocket fuel.
What Traders Are Watching This Week
Traders are watching this week’s Federal Reserve and European Central Bank decisions, along with megacap tech earnings, for a potential catalyst to push Bitcoin out of its current range.
If the Fed signals any softening on rates, or tech earnings come in strong enough to lift broader risk appetite, Bitcoin has the setup to finally clear USD 80,000. If neither delivers, expect more of the same sideways action between USD 76,000 and USD 79,500.
The Iran situation remains the wildcard. Each fresh headline out of the Strait of Hormuz has moved this market for weeks. There have now been four major Iran-related escalations since the conflict began on 28 February, and the pattern is consistent. Price spikes, shorts get squeezed, then the move fades when the diplomatic signal does.
What Happens Next for the Bitcoin Price
The ceiling is clear. The demand underneath it is stronger than it appears. And the macro calendar this week is packed.
The Fear and Greed Index sits at 31, indicating fear, with Bitcoin showing 50% green days over the last 30 sessions and 5.45% price volatility. It is not a euphoric market. Most retail participants are cautious.
That might actually be healthy. Big moves tend to start when the crowd is not expecting them.
Whether this week delivers the catalyst or not, USD 80,000 remains the number everyone is watching. Breaking it with conviction would be the first meaningful milestone for Bitcoin in months.
Also Read: Bitcoin Comeback Accelerates As BTC Ends Week With Fourth Straight Gain
Disclaimer: This article is for informational purposes only and does not constitute financial advice. Cryptocurrency markets are highly volatile. Always conduct your own research before making any investment decisions.