

XRP is in a tight range as technical indicators indicate a potential reversal. The cryptocurrency is probing significant support and resistance levels while awaiting confirmation of the next direction.
TD Sequential Flips to Buy on XRP
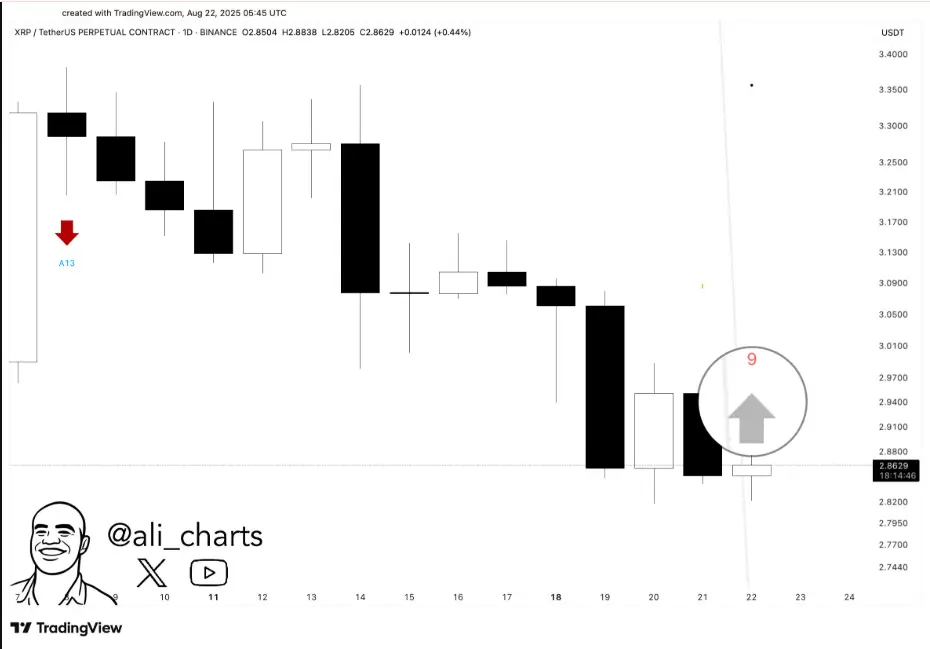
A recent tweet by analyst Ali (@ali_charts) shared that the TD Sequential indicator has produced a buy signal on XRP. It comes after a sell signal, which correctly predicted the local top around $2.00.
Source: Ali On X
The TD Sequential is a popular tool that has been constructed to identify trend exhaustion by tallying sequences of candles. In this case, the recent signal suggests selling pressure may have dropped, with the market now in a possible recovery phase.
Candlestick patterns confirm that XRP experienced several strong downward movements after the $2.00 peak, with small candles near the lower point. This is a sign of decreasing bearish momentum. The current buy signal has appeared within the $0.55–$0.60 range, with support building near $0.50–$0.55.
Key Levels From Previous Sell-Off
The head resistance level is still in the vicinity of $2.00–$2.20, with the nearest support at $0.50–$0.55. If the momentum increases, XRP can attempt to recover back into $0.75–$0.80, with $1.00 acting as psychological resistance.
If the buy signal fails and support gives way, XRP can revisit $0.40–$0.45. This becomes the critical test for reversal or correction.
Current Market Data
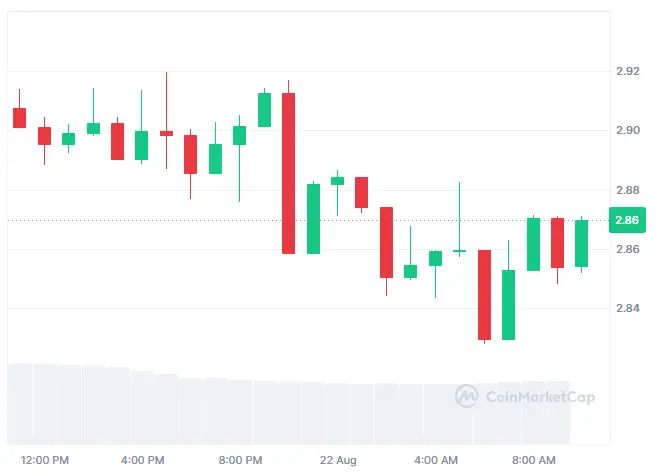
At the latest session, XRP trades at $2.85, down 1.73% in 24 hours. Its market cap is still $169.86 billion, ranking third overall.
Source: CoinMarketCap
Trading volume for the last 24 hours has declined to $4.48 billion, down 24.5%. Volume to market cap ratio is 2.85%, which reflects a relatively low turnover compared to previous days.
Supply in circulation stands at 59.41 billion XRP out of 100 billion tokens. Fully diluted value stands at $285.87 billion if all the tokens were distributed into circulation.
Price Consolidation Between $2.84 and $2.92
Existing candlestick patterns on the daily chart indicate XRP trading between $2.84 and $2.92. Several red candles dominate green candles, reflecting ongoing selling activity.
Buyers have consistently supported the $2.84 level, but sellers have been pushing back on price increases above $2.92. This has created a tight consolidation range where buyers and sellers await volume verification to move the price.
An extension above $2.92 can potentially push XRP up to $3.00 and potentially as far as $3.10–$3.20. A break below $2.84 can then hold $2.80 and $2.75.
Indicators Suggest Short-Term Reversal
Source: TradingView
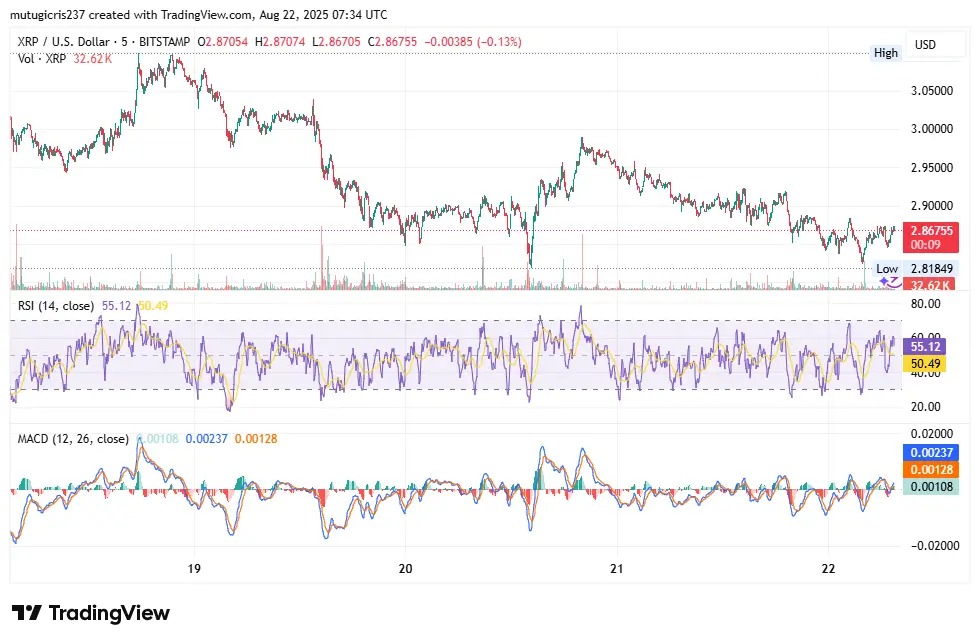
On the five-minute chart, XRP is trading at $2.87261, with highs of $3.05 and a recent low of $2.81849. The RSI is at 61.32, above the middle 50.37 line, suggesting growing bullish pressure.
The MACD line of 0.00099 is above the signal line of 0.00064, confirming a bullish crossover. The histogram is positive at 0.00036, also showing short-term pressure to move up.
This indicates XRP is rebounding from the $2.82 support low. Nevertheless, short-term resistance remains at $2.90–$2.92, and buyers will have to break past this level to hit $3.00–$3.05.
Short-Term and Medium-Term Scenarios
In case buying pressure persists, XRP may rally towards $2.90–$2.92, and a confirmed break should try to test the $3.00 level. Sustained momentum may drive prices even higher to $3.05.
Failure to break resistance might see a retest of the $2.82 support level. If that is also unsuccessful, the price will fall to $2.80 and $2.75. Medium-term pressure remains from the last high of $3.05, which formed a lower high pattern.
Final Thoughts
XRP is currently basing in a narrow range, with metrics leaning towards a near-term bounce. The levels to watch remain $2.82 support and $2.92 resistance. Volumes are under close observation from traders, as a definitive breakout would validate the next direction to $3.00 or $2.75.