

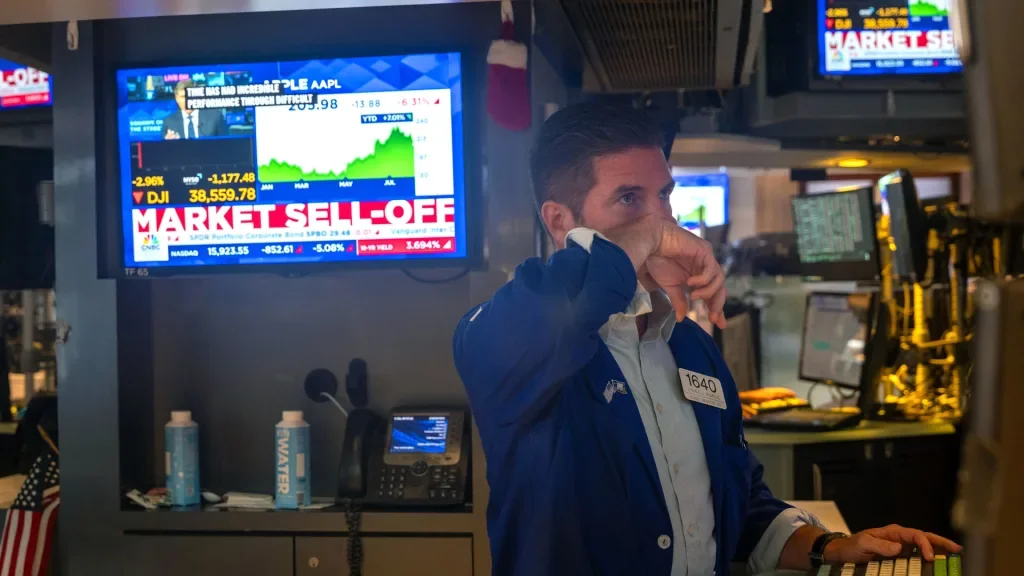
The global cryptocurrency market sees nearly US$160 billion of value being extinguished in a fiery 48 hours as investors see the start of a mad dash to sell their holdings. Bitcoin falls beneath the US$110,000 mark once more; Ethereum under US$4,000. Derivatives market forced liquidation episodes — more than US$1.6–1.7 billion of leveraged positions reversed in a single day — and expiry and ETF flows add more gasoline to the fire. The event is built upon already bearish supports: a just-cut Fed interest rate, a monstrous options expiry, and some increase in regulatory event risk. (The Economic Times)

Two-day crypto crash wipes out US$160 billion as panic selling and liquidations send Bitcoin below US$110,000. (Image Source: The Telegraph)
What did happen — a short, bloody chronology
- Price shock: Within a matter of days in late September 2025, leading tokens plummet. Bitcoin from its August levels tests the US$109k–US$112k area; Ether sub-US$4,000. Markets lose a combined ~US$160 billion in capital. (Investopedia)
- Leverage unwinds: Deleveraging cascade long-position biased makes a margin position cascade unwind about US$1.6–1.7 billion of margin positions, adding to price dynamics. Derivatives monitors Coinglass track the largest one-day deleveraging this year to date. (coinglass)
- Options expiry: Around ~US$22–23 billion of bitcoin and ether options will expire, with risk in some strike ranges and short-term positioning supportive and able to fuel moves. (Decrypt)
- ETF flows and liquidity: Spot crypto ETFs see atrocious redemptions on big dates, placing withdrawal pressure on them and constraining bids under duress. (The Block)
Why the market crashes so badly: the mechanics
Short answer: leverage + crowd psychology + event risk.
Because the speculators are more levered, minor price drops trigger margin calls. Exchanges and platforms dump automatically to lend; their dumping lowers prices, triggering further margin calls in a feedback loop. That is what is occurring in this selling: forced liquidations contribute to the drop, causing a cascade. Statistics from derivative trackers show that longs carry the lion’s share of the hit. (coinglass)
Options expiry: as options contracts valuing billions of dollars are set to expire in hours, hedging chaos erupts. Hedging can involve selling spot or futures in a direction to offset directional risk. Hedging flows concentrate around the options’ “max-pain” levels and introduce volatility at an awfully thin set of levels — a well-proven stress-test for a market already at near high-speculative positioning. (Decrypt)
Lastly, institutional action and ETF flows matter. The biggest funds experience outflows on the rout; that incentivizes managers to quote tight or sell, drain liquidity when it most desperately needs to be sucked in by the buyers. Multi-hundred-million-dollar outflows are recorded on sessioned key sessions by flow trackers TheBlock and others. (The Block)
Leverage, expiries, and outflows spark liquidations, volatility, and a liquidity crunch. (Image Source: Inc. Magazine)
The macro context: Fed policy, inflation prints, strengthening dollar
It’s not a crypto story in a vacuum. The answer is in a dynamic macro universe. 25-basis point Fed Reserve cuts in mid-September first boost risk appetite — but simultaneously add uncertainty on what’s next. Before the U.S. personal consumption expenditures (PCE) inflation report and series of regulatory hearings, market players trimmed risk-on bets. Tighter U.S. dollar and tighter short-horizon yields make dollar-denominated cryptocurrency less attractive to marginal purchasers. Those big cross-winds help make a dangerous market a quick unwind. (Federal Reserve)
Fed cuts, a strong dollar, and inflation fears unsettle markets, speeding the crypto sell-off. (Image Source: AInvest)
Who gets hurt and who profits in the quiet
- Leveraged and retail traders are the ones getting hurt, most obviously — margin calls pull in positions, and small accounts endure disproportionate pain. CoinGlass-style trackers reported hundreds of thousands of traders were shut out on the wave. (coinglass)
- Derivatives desks and market-makers incur net short-term when they mis-hedge but earn liquidity spreads and funding fees; when there is increased volatility, they lose and gain rapidly. (coinglass)
- Conservative short-term mutual fund and ETF investors remain on the sidelines, some of them using the decline to accumulate, particularly those with longer mandates. Spot ETFs are adequately resourced with assets under management and can act as a shock absorber in some cycles, Investopedia continues. (Investopedia)
- Backlog exchanges order books and risk systems — worst case: client balance breakdowns to ship or risk-management breakdowns. Regulators take note. Reuters and others report an exchange plan for contingency scenarios in the midst of disruption. (Reuters)
The human factor: what traders and investors are experiencing
For all, this flip in the market evokes a kettle of emotions: opportunism, fear, relief, shame. For a 20x day trader, a 5-10% move erodes capital overnight. For longer holders, correction is a test of courage and conviction. Street anecdotes and interviews tell of skews between “buying the dip” and vowing to wait for “clear bottoms.” Cultural fact: crypto boom cycle draws big players into the game today, but liquidation psychology hasn’t changed.
(Instrumental voice: not investment guidance — for chronological action and warning, see FAQ below.) (coinglass)
The institutional perspective: Are ETFs risk-reducing or risk-amplifying?
Spot ETFs introduced actual institutional rails into crypto. They indicate capital inflows in a bull market but introduce new behaviors during stress: redemption windows, authorized participant behavior, and cross-product hedging. And then, when redemptions spike in ETFs — a few hundred million of net outflows here and there and everywhere one day, the lack of liquidity encourages market-makers to increase premiums. Flow trackers and TheBlock record mind-boggling daily outflows in the recent sell-off, which also create mechanical selling pressure in an illiquid market. (The Block)
Thus, ETFs maintain prices in tranquil but not event-driven, spur-of-the-moment liquidity demand markets.
Why regulators and hearings matter — and how they influence price action
A regulatory cycle generates volatility. Hearings and comment periods this month — joint industry/agency roundtables and tax talks — compel the trader to price policy shock risk. When regulators have indicated greater regulation, money has left; when they have indicated clarity, confidence has come back. Decrypt and others cite a series of high-level policy events during the correction, generating event risk and compelling traders to hedge into puts. (Decrypt)
Are stablecoins and on-chain participants secure?
Stability risk is described in terms of surprise offloading. Big stablecoins maintain their pegs here, but stress reveals liquidity bottlenecks in decentralized finance (DeFi) — slippage, locked-in markets, or atomized liquidity on lower chains. Chain analysis businesses remind the reader that hacks and scams are another structural risk, even if prime tokens are okay. Investors must monitor counterparties and custody. (Medium)
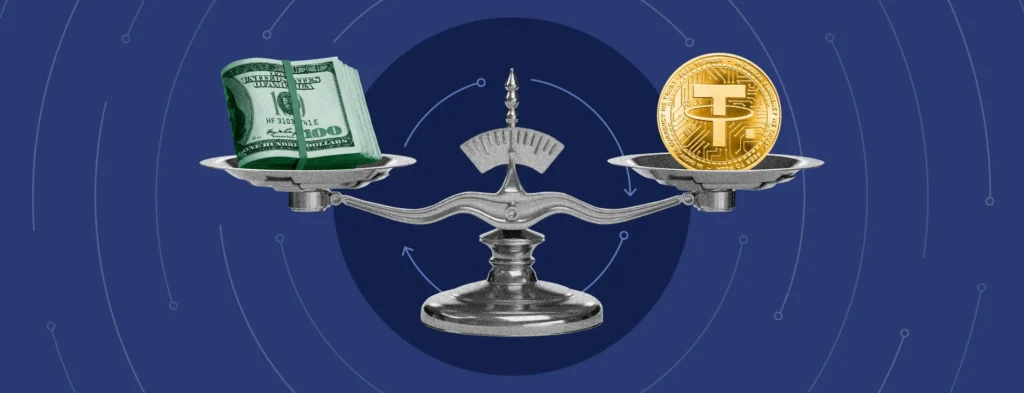
Stablecoins hold, but DeFi strains and on-chain risks demand vigilance. (Image Source: Chainalysis)
Technical read: levels to watch
These are the short-term lows and resistance that chartists, the market players, would like to observe: Bitcoin’s short-term lows of US$107k and US$102k; overhead resistance of US$117k–123k. On Ethereum, keep an eye on support at US$3.7k–4.2k and the direction of the 50-day moving average. Market observers and technical analyses pinpoint RSI weakness and momentum divergence as the cause for the correction, bottoming somewhere. (Investopedia)
What this crash is teaching us about the structural weaknesses of crypto
- Too much leverage remains king: despite experience, both retail and institutional traders alike still lever up big thanks to perpetual swaps and derivatives. That just magnifies all shocks. (coinglass)
- Deteriorated liquidity under stress: markets are deep in unstress and thin in unstress — bids vanish when needed most. (coinglass)
- Event clumping: macro prints, option expiration, and regulatory milestones group together; where there are more than a handful of events at the same time, market response is not linear and very fast. (Decrypt)
- Counterparty and execution risk: exchanges and market-makers operationally strained; chain of custody and settlement most dire at sell-off. (Reuters)
The crash wasn’t random.
Bitcoin’s share of leverage fell behind altcoins. Stablecoins wobbled. Low-cap coins pumped & dumped 90%. Volume was thin, leverage maxed, volatility crushed.
That mix guaranteed an outsized reaction — and we just saw it.
https://t.co/WWwWxFt5OA pic.twitter.com/yZtMLPPFqT
— Jessica Gonzales (@lil_disruptor) September 23, 2025
What traders, HODLers, and new entrants need to remind themselves (practical, prudent actions)
- Don’t over-leverage. Forced liquidations are the worst of all evils. The majority of dollar value lost during the event comes from leveraged long positions, data suggests. (coinglass)
- Hedge counterparty risk. Select exchanges and custodians with sound risk management and disclosure. Regulatory oversight follows big moves for a reason. (Reuters)
- Use dollar-cost averaging for long-term exposure. A correction is painful today, but forced timing is more expensive than patient construction.
- Use invested exposure through controlled ETFs if you require controlled custody and improved settlement practices — but ETF flows get distorted during distress. (Investopedia)
Market rumour (expert opinion aggregating)
They are calling it a deleverage-dominant correction, rather than a structural break. They concur that the short-term spot ETF flows in the first half of the year enabled one to construct a bigger and more solid investor base, but nevertheless, the derivative complex is generating too much short-term volatility. Some market strategists view the sell-off as a “reset” that separates out the speculative froth from the market before hopefully smoothing out Q4 — though the way to recovery remains far from guaranteed. (Investopedia)
The possible outcomes: three scenarios
- V-shape rebound (bullish): Options expiry in the rearview mirror, macro data comforting, and consumers reach cheaper prices. Longs and ETFs sweep up bargain supply. Based on no further macro shocks.
- Extended stabilisation (base case): Market trades sideways for weeks as players repriced risk, reduced leverage, and await clearer policy signals. Liquidations slow; volatility unwinds.
- Bearish overcorrection: A second bearish shock — i.e., increased regulation or sudden failure of the counterparty — creates more selling and triggers more risk repricing for the entire crypto universe. (The Economic Times)
Perpetual swaps and funding rates — the power that anchors futures to spot
Perpetuals behave similarly to never-expiring futures. Perpetuals allow users to hold leveraged positions indefinitely. In order to keep the perpetual price close to the underlying spot, exchanges employ a funding rate: an ongoing small deduction from longs to shorts. Longs pay shorts when the perpetual is above spot; shorts pay longs when the perpetual is below spot. That simple reward will push the two prices towards each other. (Binance Academy)
Why would that matter in a crash? Because funding imposes hard cash flow pressure on levered traders:
- When sentiment is good, perpetuals trade at a premium, and funding is great. Longs just keep writing — typically massive size — to remain levered. Those payments destroy retail and smaller institutional accounts.
- With declining price, advance-funded longs will roll over to borrow to short the future funding payment, which puts additional selling pressure on the market. Market-maker hedging (delta hedging) reinforces that effect since hedges involve selling spot or futures into a declining market.
That feedback loop — funding payments → position unwinding → price fall → even more liquidations — is what triggers the mechanism by which a minor fall can become cascade liquidations.
Day 2/7: Perps 101 – Leverage: Your Best Friend or Worst Enemy?
Perpetual futures let you bet on crypto prices without expiry, using leverage (borrow to amp positions). 50x means $1K controls $50K—win big on ups, but lose everything on small dips. Aster boasts 1001x+;… pic.twitter.com/QnWGVV5D5A
— ReiSoleil | 瑞首雷尔一世 (@ReiSoleil) September 26, 2025
Anatomy of a liquidation cascade (why forced resales in small quantities become a market event)
Liquidation is structured: when margin is tight on maintenance, exchanges force-close positions to shield lenders. In regular markets, that happens in bite-sized nibbles. Under duress, it doesn’t:
- Positions are clumped together — short sellers used leveraged long positions clumped at the same entry points.
- There is a trigger event — options expiry, surprise macro print, or ETF redemptions- that induces a supply/demand shock.
- Margin calls snowball — price slippage hits maintenance margins; exchange covers; market depth disappears.
- Slippage leads to further selling — liquidation fills drive price below limit orders would have kept it at, triggering further margin failures elsewhere.
- Cross-product contagion — options and funding delta hedging hedges initiate extra spot and futures selling and the move.
At their recent show, trackers lost ~US$1.6–1.7 billion positions sold on the worst days, evidencing only this cascade effect.
(see second example below chart: price line declines and there is a thin band of scaled liquidation volume at the bottom down — that evidences severity and timing of liquidations.)
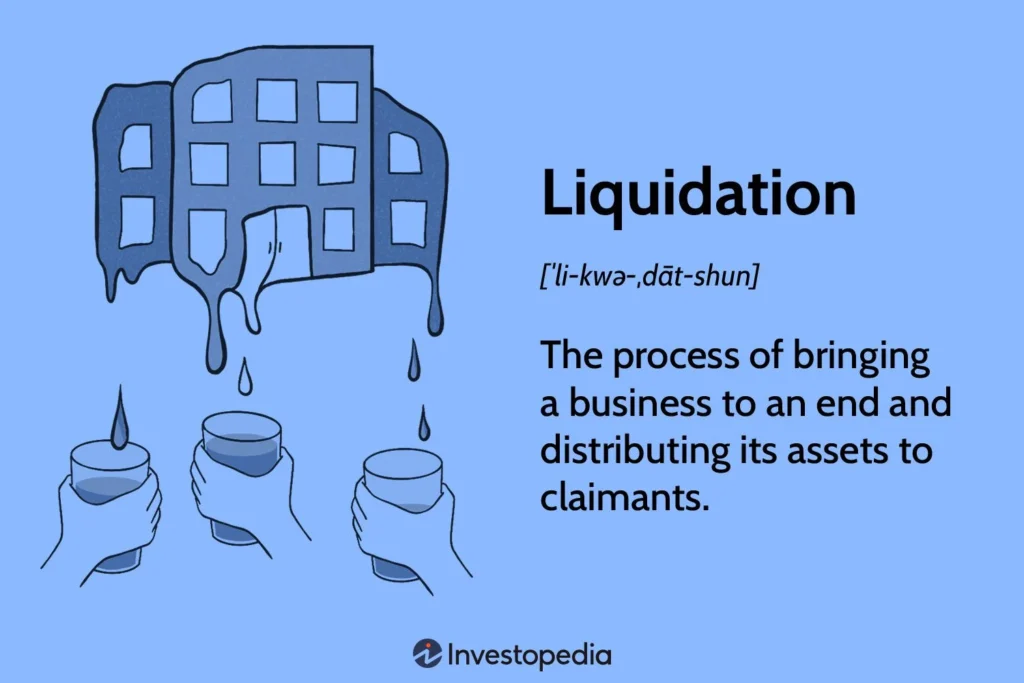
Leverage triggers margin calls, draining liquidity as hedging spreads the shock. (Image Source: Investopedia)
Options expiration and the “max-pain” gravitational force
Options are speculative in expiry dates. With trillions of notional options in single strikes, market-makers hedge off by selling or buying offsetting delta exposure in spot/futures. The result: hedging flows at expiry can drive the market towards the strikes where option writers have to make the minimum payouts — the so-called “max-pain” area. The ~US$22–23 billion of open options in late September compelled risk into a tight range and opened the market up for short-squeeze action. (Cointelegraph)
When there is overlap of redemptions concurrent with high leverage and low liquidity, hedge flows get herded: ordered, bunched, and thus market-moving.
ETFs, redemptions, and institutional plumbing are altering the game
Institutionalized rails and deep pockets in crypto via spot ETFs; that’s helpful in normal markets. But ETFs are not a magic buffer: issue/redemptions are facilitated through authorized participants that trade ETF shares for underlying spot (or vice versa). When there are net redemptions from the ETFs, redemptions are funded by APs by selling spot to the market. On the day, on such a day, structured ETFs have reported humongous daily redemptions (hundreds of millions on large days), and these flows add to the weight of the supply in a squeeze.
Briefly: ETFs redefine the scale of flows and establish new mechanistic connections between spot liquidity and institutional demand. In quiet, it is a stabilizer; in stamped,e it amplifies the size which must be absorbed by the market.
A proper chronology (headline events, late-September)
- Sept 17, 2025 — Fed reduces 25bp. Macro risk re-priced by markets and market makers’ risk exposure.
- Lower leaves uncertainty nodes about the direction of travel.
- Late Sept 21–26, 2025 — Liquidation wave: derivatives leveraged deleveraging causes the largest liquidation sizes of the year (~US$1.6–1.7bn reported).
- Late Sept (window of expiry) — ~US$22–23bn of expiry options: clumpy expiry clusters push hedging flows into a narrow window.
- Sept 25, 2025 — ETF redemptions peak: some hundred million of spot ETF flows put selling pressure on thin order books.
- Accumulative effect — in the window, the market caps lose around US$160 billion in days.
Also Read: Minnesota Family Crypto Kidnapping Shocks US
Practical playbook — what risk teams and traders need to do now
This is not an investment suggestion; it is learning. With that, rational, war-hardened wisdom removes tail risk:
- Amputate early leverage. Leverage both amplifies P&L and system feedback. Reduce leverage and time-slice exposure.
- Monitor funding and open interest. Rising positive funding (longs paying) is an indication of overbought bull positions. Exchanges and trackers report these statistics in real-time — watch them.
- Stack positions at large experiences. Avoid close expiry windows whenever possible; consider them as timed storms.
- Hedge, not speculate, with options. Defensive puts or collars reduce the downside without identical liquidation geometry.
- Counterparty stress limits. Control exchange insurance accounts, margin engines, and withdrawal rhythm — you need a clean platform when market breadth disappears.
- Use regulated channels for large allocations. Regulated custody and ETFs reduce execution risk when you’re trading volume — but remember ETFs equate to selling spot to cover redemptions. (Yahoo Finance)
Frequently asked questions (FAQs)
Q: Did the market actually lose US$160 billion over two days?
A: Market-capitalization valuations by different aggregators and financial news portals place the size of the crypto market value at US$160–162 billion. That follows aggregate price declines for top tokens.
Q: What was lost in derivatives?
A: Trackers and derivatives exchanges report US$1.6–1.7 billion liquidations on the biggest session, with long positions in control. Behind much of that reporting are Coinglass and some other similar data providers.
Q: End of crypto?
A: No single correction closes the market. Crypto remains cyclical and volatile; the effect is more about revealing weakness than barely lifting suspect underlying structural trends (e.g., ETF approval) that have spurred institutional participation. Volatility does require risk tolerance adjustment and position size adjustment.
Q: Is the Fed going to have more falls?
A: Risk assets are susceptible to inflation prints and monetary policy. Fed Sept 25bp cut and soon-to-be-released data fuels headline risk; markets react to uncertainty regarding the pace of cuts or tightening. Those macro drivers get quickly priced by participants and cause crypto moves to take center stage.
Q: Do I sell into the panic
A: Not personal investment advice. Panic selling likely locks in the loss. Reflect on your time horizon, risk tolerance, and leveraged positions. If in doubt, consult with an experienced financial planner.
What journalists and policymakers have to watch out for next
- Derivatives open interest and how margin levels are behaving. Sudden, large increases in open interest or funding rate volatility are an indication of fresh stress.
- ETF flows — steady outflows vs. sudden rotations will establish whether sentiment realignment is reversible. (The Block)
- Regulatory notices and enforcement action — disclosure can stabilize, surprise enforcement can destabilize. (Decrypt)
Final summary (what the charts are indicating in one sentence).
Perpetual funding and expiration options lock-in positions lock-in flows; when multiple players are locked in the same way and there is no liquidity, mechanical margins and payment engines add a $100-plus-billion spin to a correction in hours. The solution isn’t magic — better risk management, cleaner pipes, and better counterparty standards.