

Chainlink rose above the $26 level on Thursday after recording a 6% intraday increase. The surge came on the back of a dramatic rebound from recent lows as trading volume crept up incrementally to support new bullish pressure across the market.
Price movement over the last 24 hours
Chainlink began trading at around $25.68 before falling under selling pressure that took it below $24.00. That intra-day low proved to be a short-term low as the buyers moved back into the market quickly. By the late afternoon, LINK broke above $25.50 and through $26.00, turning a key resistance point into support.
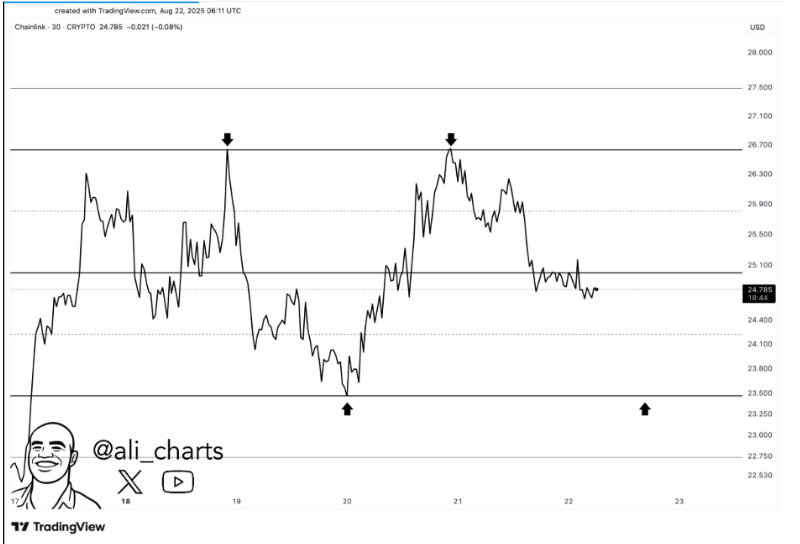 Source: Ali on X
The latest candlestick closed at $26.62, the day’s high, and a reflection of firm demand. Numbers mark a 6% increase in 24 hours, with the sharp bounce back from losses that dominated most of the day’s trading.
Technical Levels Shaping the Market
The current chart also shows two significant areas of support. The first is near $24.00, the intraday low, and the second at approximately $25.00, which has been a base of consolidation in the past. Both these levels are where the buyers will continue to remain active.
Resistance levels are at $26.61 to $26.70, which is the current high. If price action continues above this range, the next levels extend toward $27.50 and even $28.00. To stay above $26.00 is essential right now to maintain bullish conditions in the short term.
Market Metrics Support the Price Rally
Chainlink’s market capitalization stood at $18.05 billion after the rally, taking the 6% price increase. Its fully diluted value is now placed at $26.62 billion, consistent with the total supply framework.
Trading.volume rose to $2.63 billion in the last 24 hours, rising by 4.52%. This surge in activity is an indication of active participation by market players and proves the fact that the price rise is supported by liquidity. The ratio of volume to market cap is at 14.6%, a number which reflects sound trading conditions.
Supply Structure Remains Balanced
Statistics indicate that Chainlink has a total supply of 1 billion tokens, out of which 678.09 million LINK tokens are already floating in the system. This represents about 67.8% of the total supply. As a majority of the tokens are already circulating, the risk of inflation through new issue is still contained.
Such a supply structure still offers steady trading conditions. Investors remain confident that regulated supply distribution boosts long-term value and reduces the risk of sudden market irregularities.
Technical Indicators Point Toward Momentum
Confirmation of the breakout seen in LINK comes courtesy of indicators. The relative strength index is 66.16, reaching almost overbought levels but still below 70. This means momentum is good but under control.
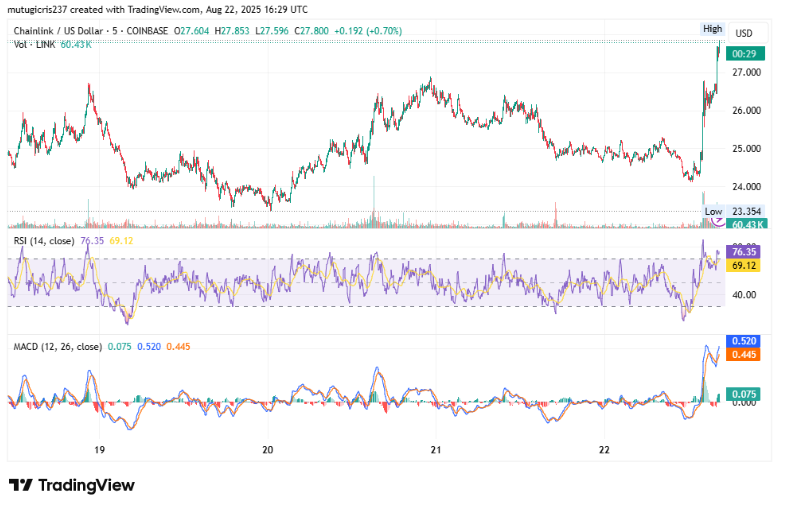 Source: TradingView
The MACD recently posted a bullish crossover as the MACD line moved above the signal line. This provided the catalyst for the upmove, although the histogram suggests momentum may be flattening after the dramatic rally.
Broader Market Context
The steep surge was accompanied by high volume trading, confirming good participation. Analysts explained that such spikes are typically followed by a consolidation period, which LINK had already experienced earlier in the $24.80 to $25.20 range.
Tweets from market analysts pointed to the double top pattern at $26.70 seen on the 30-minute chart last week. That’s still the key resistance level in the near term. A breakout above this level confirmed could lead LINK to $27.50 and ultimately the $30.00 psychological level.
Also Read: XRP Price Analysis Signal Buy as Market Consolidates
Final Thoughts
Chainlink showed fresh vigor after it recovered from $24.00 levels and moved beyond $26.00 with favorable volume support. All technical indicators confirm momentum, while supply data and market capitalization data provide a good background. As long as LINK continues to trade above $26.00 levels, the technical perspective remains geared towards challenging higher resistance in the vicinity of $27.50 during the forthcoming sessions.