

Bitcoin (BTC/USD) is changing hands around $63,751.55 on the 45-minute chart. The picture isn’t pretty for bulls. Price action points to a bearish structure after a breakdown from a previously established consolidation range. So is this a quick breather or the start of something bigger? This Bitcoin price analysis walks through the levels that should answer that.
For a while, Bitcoin drifted between approximately $63,300 and $65,550. Neither side had the upper hand. Then the floor gave way. That break signalled a shift in short-term momentum, and sellers noticed. When a range fails like this, control tends to change hands. The chart suggests that’s what happened.
Bitcoin market momentum is what traders are really weighing here. After the breakdown, BTC slid toward the 62,200 region before it started to recover. The bounce looks tempting at first glance. Look closer and it’s more of a retracement than a confirmed bullish reversal. Momentum has turned, yet buyers haven’t shown they can grab it back.
Why the Market Structure Has Turned Bearish
Four details sit behind the bearish read, and they build on each other.
- Bitcoin previously traded in a consolidation range between approximately $63,300 and $65,550.
- The market eventually broke below that range, signalling a shift in short-term momentum.
- After the breakdown, BTC fell toward the 62,200 region before starting to recover.
- The current upward move looks like a retracement, not a confirmed bullish reversal.
A bounce after a sharp fall is normal. Dip buyers often show up near the 62,200 region. But one bounce doesn’t flip a trend. Until buyers clear the resistance overhead, sellers keep the edge. Think of it as a pullback inside a weaker structure.
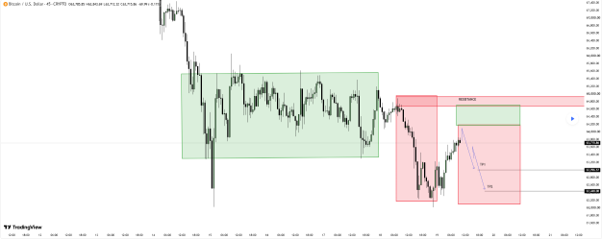
Retracement from the 62000-62,200 region toward the resistance zone on the BTC/USD chart. [Trading View]
Where the Key Resistance Zone Sits
The major resistance zone sits at 64,950. It’s a highlighted supply zone, and it’s where sellers may regain control. This is the first real test for the current recovery. Supply zones tend to pull in fresh selling. Traders who bought higher may also sell into any strength there, just to get out. That extra supply can cap a rally fast.
A rejection from here could strengthen the bearish outlook and give downside continuation another go. Watch the candles closely. The $64,000 psychological level matters too. How price reacts there may hint at buyer strength or weakness before the main zone gets tested. Round numbers often attract plenty of orders.
Now the flip side. A decisive break above 64,950 would invalidate the immediate bearish setup. The bounce from 62,200 would then look far stronger than it does today. Shorts would need a rethink. That’s why this zone carries so much weight.
How the Bearish Scenario Could Play Out
The chart hints at a possible short setup. It only works if price retraces into the highlighted resistance area and shows bearish confirmation. The preferred path looks like this.
- Price retraces toward the 64,950 resistance zone.
- Sellers defend the resistance area.
- Bearish confirmation develops.
- Price potentially moves toward TP1 at $62,996.57.
- Further downside could extend toward TP2 at $62,440.08.
Patience is the hard part. The setup isn’t live until sellers defend the zone and confirmation appears. Jump in early and you’re guessing, not trading. TP1 at $62,996.57 and TP2 at $62,440.08 are the projected profit-taking zones on the chart. Treat them as markers, not promises. The short-term bias stays bearish while BTC trades below the marked resistance zone.
What Traders Should Keep in Mind
A tidy setup can still go wrong, so these four checks keep things honest.
- Avoid entering short positions without bearish confirmation.
- A decisive break above the resistance zone could invalidate the immediate bearish setup.
- Monitor price reaction around the $64,000 psychological level.
- Manage risk carefully and use appropriate stop-loss placement.
Risk management isn’t glamorous. It still decides most outcomes. A setup can look perfect and fail anyway. Stop-losses exist for those days. Size positions so one bad call doesn’t do lasting damage.
Bearish Bias: BTC/USD currently favours a bearish continuation scenario, with 64,950 as the key resistance area. The main focus is a possible rejection from this zone, targeting $62,996.57 and then $62,440.08. A decisive break above would weaken that view. Buyers would then be back in charge of the short-term story.
Also Read: Ethereum Price Analysis: Three Market Signals That Could Shape the Next ETH Move
BTC USD Technical Analysis: Frequently Asked Questions
Q1: What is the current Bitcoin price on the chart?
A1: BTC/USD is changing hands around $63,751.55 on the 45-minute chart. That’s a bounce off the 62,200 region.
Q2: Where is the key resistance zone?
A2: The big one sits at 64,950. If sellers push price back from there, the bearish view gets stronger.
Q3: What are the downside targets?
A3: TP1 is $62,996.57, and TP2 sits lower at $62,440.08. Both are projected profit-taking zones marked on the chart.
Q4: What could invalidate the bearish setup?
A4: A decisive break above 64,950 would undo it. Keep an eye on $64,000 before that happens.
Disclaimer:
This article offers general commentary on BTC/USD and isn’t financial advice. The levels mentioned, including 64,950, $62,996.57 and $62,440.08, are chart-based scenarios, not forecasts. Bitcoin is volatile, and a short position can lose money fast if price jumps higher. Please do your own careful research, think about your risk tolerance and speak with a qualified, licensed adviser before trading anything.
