

Ether changed hands at $1,803.26 at 21:53 UTC on November 17. That was down 1.40% in 24 hours and 12.16% over seven sessions. Market capitalisation sits at $220.39 billion on $11.86 billion of daily volume. That volume equals 17.1% of Bitcoin’s $1.29 trillion. This Ethereum price analysis looks at what those figures mean for traders.
The raw numbers look worse than the relative ones. Bitcoin fell 12.97% over the same week. So the ETH/BTC ratio ended Tuesday at 0.02805, against 0.02782 on November 10. That is a 0.8% gain in ether terms, even as both assets lost double digits in dollars. Ether also sits 18.8% below its 30-day average daily close of $2,221.86. It is 28.6% below the 30-day high of $2,526.99.
Measured by daily closes, ether is down 12.13% from $2,052.20 on November 10. Bitcoin’s matching move, from $73,762.90, is a 12.93% decline. Ether gave up 0.8 percentage points less. The ratio peaked at 0.03012 on November 4 and dropped to 0.02757 on November 14. That was the lowest close in the 30-session window. It has since recovered to 0.02805, a 6.9% drawdown from the peak and a 1.7% rebound off the low. The monthly view flips the ranking. Ether is 25.15% below its October 18 close of $2,409.12. Bitcoin is 21.75% below its own. Ether looks like a high-beta follower rather than a leader.
Where ETH Market Analysis Finds Support and Resistance
Now to the levels. Intraday lows on Binance’s ETHUSDT perpetual contract tell a tight story. Ether bottomed at $1,726.26 on November 14, at $1,710.01 on November 15 and at $1,750.05 on November 17. Buyers stepped in each time before the daily close. Those closes were $1,768.36, $1,834.28 and $1,802.84 respectively. Tuesday’s high was $1,843.16. The seven-session high is $2,135.90, set on November 10.
The November 14 session looks like forced selling rather than drift. It carried 7.41 million ETH of perpetual volume against a 30-day average of 3.59 million. That is 2.06 times normal. Price has not revisited the $1,726.26 low since. Meanwhile, nothing has come within 14% of the November 10 high. That string of lower highs is the clearest bearish structure in the data.
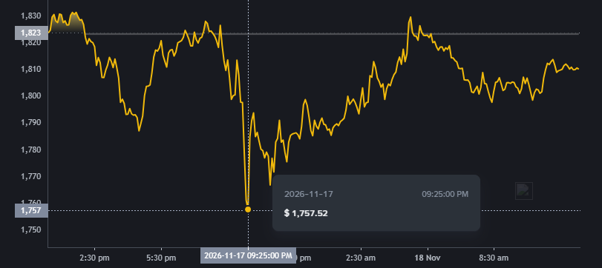
Three daily lows between $1,710 and $1,750 form the support zone traders are watching. [Binance]
Three Signals Behind Ethereum Market Trends
Positioning data adds colour to the price action. Three readings matter most right now.
- Funding rate: Binance’s ETHUSDT perpetual carried 0.005485% per eight-hour interval at 21:58 UTC. The baseline is 0.01%. Longs still pay shorts, but only barely.
- Open interest: It stood at 2,284,265 ETH worth $4.157 billion on November 17. A week earlier, it was 2,244,061 ETH worth $4.789 billion. Contracts grew 1.8% while dollar value fell 13.2%.
- ETH/BTC ratio: It sits at 0.02805. The October 18 level of 0.02935 is the number to watch.
How Leverage and Fear Are Shaping Sentiment
Leverage and mood explain much of the current calm. Four readings stand out.
- Cleared leverage: Funding annualises to about 6.0% a year, against 10.95% for the neutral baseline. Most leveraged longs appear to have been flushed out.
- A small discount: The perpetual traded at $1,802.76 against an index price of $1,803.42. That is a 0.036% discount, slightly on the wrong side for bulls.
- Coins versus dollars: Peak open interest was 2,339,782 ETH on November 13, valued at $4.724 billion. Implied notional per ETH fell from $2,134 to $1,820, a 14.7% drop. That reflects price, not new positioning.
- Extreme fear: The Crypto Fear and Greed Index printed 12 on November 17, its fifth straight extreme-fear reading. Across 26 earlier single-digit prints, the median 90-day bitcoin gain was just 1.4%.
What Could Change the ETH Trend
Two prices decide what happens next. Each carries a clear message.
- Downside trigger: A daily close below $1,710.01 would invalidate the floor read. The three lows would then be a pause inside a downtrend.
- Upside trigger: A daily close above $2,135.90 would break the lower-high sequence.
- Ratio drag: Had the ratio held 0.02935 with bitcoin at $64,226, ether would be at $1,885. That is about 4.5% above the current price.
- A note of caution: Funding, open interest and the ratio describe positioning, not causes. Treat any single-cause explanation for the fall as a hypothesis until flow data confirms it.
Also Read: Bitcoin Price Decline Tests Investor Confidence in Strategy, Coinbase and Circle
Frequently Asked Questions
Q1: What is the Ethereum price today?
A1: Ether traded at $1,803.26 on November 17. That is down 1.40% in 24 hours and 12.16% over seven sessions.
Q2: What is the ETH/BTC ratio right now?
A2: The ratio ended Tuesday at 0.02805, up from 0.02782 on November 10. That is a 0.8% gain while both assets fell double digits.
Q3: What is the key support level for Ethereum?
A3: The 30-day low of $1,710.01 is the level to hold. Three daily lows between $1,710 and $1,750 have each been bought back.
Q4: What would signal a trend change for ETH?
A4: A daily close above $2,135.90 would break the lower-high pattern. A close below $1,710.01 would invalidate the support argument.
Disclaimer:
This article is general information only and is not investment advice. Ether is volatile, and the levels cited reflect a 30-session window ending November 17, 2026. Funding, open interest and sentiment readings describe positioning, not future prices. Single-digit Fear and Greed outcomes guarantee nothing. Crypto assets can lose value quickly. Research independently and speak with a licensed adviser before trading.
