

Bitcoin is the biggest cryptocurrency in the world, and this October, traders are closely watching it. The coin was selling for approximately $86,160 on 5 October. That came after some $84,500 was spent on 2 October. One of the analyses highlighted an almost 44 % increase in three months. The above prices are preliminary prices for early October. Please check a current feed for today’s price.
The price of BTC is crucial to analyse because the rally has stalled at an important ceiling. Buyers are on the move, but prices have not moved far from the end of September. This is the general Bitcoin market tone for the coming weeks. Investors are looking to see if there is momentum that will either increase or decrease.
In September, US spot Bitcoin ETFs saw $2.65 billion in net inflows. Now, the funds have approximately $109.3 billion in bitcoins. Despite that, there has been limited price increase since the end of September. There is only the buy side of the ETF market.
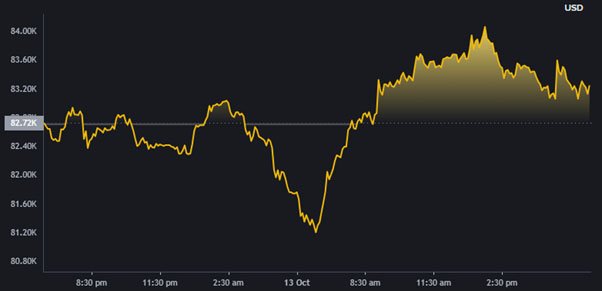
Bitcoin traded near $84,500 on 2 October 2026 as September ETF inflows reached $2.65 billion. [Binance]
Why ETF Flows and Leverage Shape the Bitcoin Market Outlook
There are a number of reasons why Bitcoin’s next move is so tight right now:
- Fading ETF Demand: Investors pulled their money out of ETFs at a 13% rate from their record high of 21 September in just four sessions. That diminishes an important avenue of spot business.
- Leverage Risk: Binance has $4.35 billion of long positions at a price below the 30-day timeframe horizon. If the dip gets deeper, it may result in forced selling.
- Seasonal Support: October was higher in 10 of the last 15 years, averaging a gain of 11.2%. History still favours the bulls.
- Price Analysis: Bitcoin Support and Resistance Levels to Watch: In this episode, we will explore Bitcoin price analysis using support and resistance levels.
The next move is charted by traders using support and resistance. Resistance sits near $87,400, while support spans $81,700 to $82,800. A clean break above $87,000 could open the door to $90,000. If there is a breakdown of the support level, Bitcoin could head towards the $74,000 to $78,000 range. $80,811 is another level of interest, with $74,957 as the downside target if that price break is made.
When and How Macro Events Could Move BTC
The following scheduled and structural events may turn the tide in the next few weeks:
- Fed Policy: Minutes from the September meeting due on 7 October. But the Fed meeting on October 28 remains to be seen.
- Inflation Data: If the figures come out hotter than expected, risk appetite in the cryptocurrency markets may take a hit.
- Regulation: Greater clarity on crypto regulations is likely to boost institutional interest, but uncertainty may have the opposite effect on prices.
- Flushed: Over $19 billion of leveraged bets were lost on 10 October 2025. A further squeeze is still on the cards.
What Analysts Say in the BTC Price Prediction Debate
The forecasts are still highly divergent; investors should carefully consider each forecast:
- Standard Chartered: $100,000 by the end of 2026, cut from $150,000.
- Bernstein: $150,000 by end 2026, cut from $200,000.
- JPMorgan: $150,000 to $170,000 in 2026, unchanged.
- Bearish Views: Peter Brandt sees as low as $25,000. NYDIG outlines a $38,000 to $39,000 scenario.
The range of views spans $25,000 to $170,000. There are no definitive predictions, and traders should anticipate rising prices as well as falling prices. Keep an eye on ETF trading in the coming days, as well as the $87,400 ceiling and $81,700 floor.
Also Read: Bitcoin Selloff Tests Key Support as $394 Million in Crypto Positions Are Liquidated
Bitcoin Price Analysis FAQs
Q1: What’s the main resistance level for BTC at the moment?
A1: Resistance levels mentioned include $87,400 and $87,000. A clean break could open the way to $90,000.
Q2: Why did Bitcoin fail to overcome despite inflows of ETFs?
A2: September ETF inflow was $2.65 billion, but other factors in the market offset that demand. Later,r they decreased to 13% of their 21 September high.
Q3: Where is Bitcoin’s main support?
A3: Support spans $81,700 to $82,800. A break lower could target the $74,000 to $78,000 zone.
Q4: When has October favoured Bitcoin historically?
A4: 10 of the past 15 years had an October higher than its average. The median increase was 11.2% for October.
Disclaimer:
The pricesof Bitcoins, inflows and outflows of the ETF and the forecasts of the analysts are a general overview only and do not provide any concrete information. It is not financial advice. The prices of cryptocurrencies are volatile, and the numbers mentioned are based on early October 2026. All targets from banks and analysts are estimates and not guarantees. Before investing in Bitcoin, you should research live prices, consider your level of risk and seek advice from a licensed Australian financial adviser.