

Bitcoin was quoted at USD83,625 in the 7 October 2026 report, down nearly 3% over 24 hours.
The Bitcoin selloff was accompanied by a wave of forced position closures. WazirX founder Nischal Shetty cited approximately USD394 million in one-hour liquidations across crypto, with USD384 million affecting traders positioned for prices to rise.
For someone holding Bitcoin outright, the fall reduced the market value of their coins. A leveraged trader could face a more immediate problem: insufficient margin to keep the trade open.
That difference sits behind the liquidation headline. The figures above relate to the reported period, rather than current market prices.
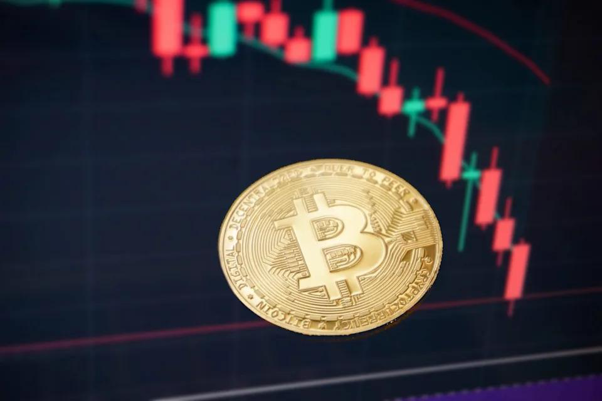
Figure 1: A physical Bitcoin token used to illustrate cryptocurrency trading. Credit: Kanchanara / Unsplash.
The Pressure Falls on the Money Behind the Trade
Leverage lets a trader take a position larger than the funds committed to it. That increases the effect of a price move on the trader’s own money.
There is a minimum amount of margin required to maintain the position. When losses leave the account below that requirement, a platform can start reducing or closing trades.
The process may happen in stages. It depends on the exchange, the contract and the way the account holds collateral. Traders also cannot assume they will receive a warning in time to act.
A trader may still believe the price will recover. The margin calculation does not depend on that belief.
How a 3% Move Becomes a Much Larger Loss
Take a hypothetical USD10,000 long position backed by USD1,000 of margin.
A 3% adverse move produces a USD300 loss before fees and other adjustments. That is nearly a third of the starting margin, even though the asset itself has moved only a few percentage points.
| Hypothetical trade | Amount |
| Market exposure | USD10,000 |
| Trader’s starting margin | USD1,000 |
| Loss from a 3% adverse move | USD300 |
| Starting margin consumed | 30% |
This example explains the exposure, not the exact point of Bitcoin liquidation. The latter requires the platform’s maintenance requirements and the account’s other details.
It also explains why two people watching the same chart can have very different experiences. One sees a decline in an asset they own. The other sees the funds supporting a much larger position being used up.
The Former Support Area Still Needs Buyers
Bitcoin’s reported move below USD84,000 put that area back in focus.
A support level is an area where buying has previously interrupted a fall. Buyers may return there, but there is no obligation for them to do so at the same price or with the same strength.
Once the market trades below it, the next approach from underneath can meet selling. Some holders may see the rebound as an opportunity to exit.
Open Interest Helps Explain What Remains
After a sharp move, the obvious question is whether substantial positions are still open.
Open interest measures outstanding derivative contracts. Trading volume measures activity over a period. The two answer different questions: a market can be very busy without a matching increase in contracts left outstanding.
Falling open interest during a decline can be consistent with traders closing positions. Liquidation data is needed to help identify the forced part of those exits.
Nor does rising open interest automatically mean buyers are gaining control. Each contract has opposing sides.
Compare Cash on Hand With the Work Ahead
A cash balance means little without knowing what it must cover. A company may report more cash than last quarter while facing a much larger bill for construction.
Timing also matters. Loan repayments, equipment orders and contractor payments may have to be made before a project generates its first revenue. A delay can extend that period even more.
Readers can compare the latest cash amount to planned expenditure and future debt repayment. Separately, look at funding already secured. When can you draw it down and under what conditions? Such details help to explain how much breathing room a company has to absorb an unexpected expense.
What to Expect Next?
Once a burst of forced selling passes, prices may recover. The harder question is whether demand lasts beyond that first response.
A bounce can offer relief without recovering the earlier loss. It can also run into holders looking for a better exit price.
Blockore readers can follow three practical checks: whether the broken area is regained, whether it holds on a subsequent pullback and whether fresh volatility brings another cluster of crypto liquidations.
ALSO READ: In China, Heavy Industry Unexpectedly Falls Sharply
FAQs
Q1. Did the liquidation figure cover Bitcoin alone?
Ans. No. It covered positions across the crypto market during the reported one-hour window.
Q2. Why does leverage make a price fall more costly?
Ans. The loss applies to the full position, which can be much larger than the trader’s starting margin.
Q3. Does heavy liquidation mean the decline is finished?
Ans. No. Further selling can occur after leveraged positions have been closed.
Q4. What should readers look for after the rebound?
Ans. The recovery price area, the change in open interest, and if forced closures continue.
Disclaimer
This article is for informational purposes and is not financial advice. Market data according to the referenced report. The trade example is a hypothetical case. Crypto prices can fluctuate quickly and leverage can amplify losses.
