
ETH is trading near $2,465.59. It is just above the daily pivot at $2,458.09. The price action still looks bullish, but the push higher feels stretched.
Daily RSI14 is at 76.06. That sits in deep overbought territory. ETH is also above its main exponential moving averages. The 20-EMA is at $2,188.81. The 50-EMA is at $2,022.70. The 200-EMA is at $2,159.21.This spread suggests the wider trend stays strong.
However, elevated momentum can increase pullback risks. The immediate battle remains between the daily pivot and nearby resistance levels.
 Ethereum price today remains above its daily pivot despite overbought momentum. [Courtesy: Cryptonews.net]
Ethereum Price Analysis Shows Strong Daily Momentum
The daily chart continues to support the bullish case for ETH. Price remains comfortably above its key moving averages. MACD also continues to reinforce the positive momentum. The MACD line stands at 161.07 against a signal of 114.41. Its histogram sits at 46.66 and continues expanding.
However, RSI at 76.06 introduces a clear caution signal. Overbought conditions can persist during strong cryptocurrency rallies. They can also precede sudden mean-reversion moves.
Bollinger Bands provide another important reference point. The daily middle band stands at $2,105.40. The upper band reaches $2,632.77. Daily ATR14 stands at 107.55, highlighting elevated market volatility.
Ethereum Resistance Levels Define The Immediate Battle
The next move could depend heavily on Ethereum’s ability to clear nearby resistance. Traders are watching several levels closely. Key levels currently include:
- Daily pivot: $2,458.09
- Resistance R1: $2,480.36
- Support S1: $2,443.31
- Upper Bollinger Band: $2,632.77
A sustained move above $2,480.36 could strengthen bullish momentum. It could also open a path towards higher resistance. Failure near that level could instead trigger a pivot retest. A move below $2,443.31 would strengthen the bearish argument. The current setup therefore remains balanced around a narrow trading zone. Confirmation could become more important than prediction for short-term traders.
Ethereum Price Forecast 2026 Faces Intraday Consolidation
Shorter timeframes look calmer than the daily chart. On the 1-hour view, ETH is around $2,465.54. The 20-EMA is at $2,463.10. The 50-EMA is close to it at $2,463.19. This tight grouping points to a short-term pause and range trading.
The 200-EMA is lower, at $2,326.94. RSI14 on the hour is 50.39, so momentum is not pushing hard in either direction. The 1-hour Bollinger Bands are narrow. The mid line is $2,461.09.
The upper line is $2,484.86. The lower line is $2,437.32. Hourly ATR14 reads 16.76, which supports the idea of low movement for now. Overall, it looks like the market may be tightening before a larger move.
Ethereum Technical Analysis Shows Mixed Short-Term Signals
On the 15-minute chart, the signals are not clean. EMA20 sits near $2,461.34. EMA50 is at $2,460.81. EMA200 is around $2,464.02.
These EMAs are packed together, so the near-term trend is hard to call. RSI14 is a bit higher at 56.5. Still, the MACD histogram is slightly below zero at -0.15. Price is staying near the intraday pivot at $2,464.34.
Traders are therefore watching the narrow range for a breakout. The immediate intraday levels include S1 at $2,462.67 and R1 at $2,467.20. A sustained move outside this zone could provide the next directional clue.
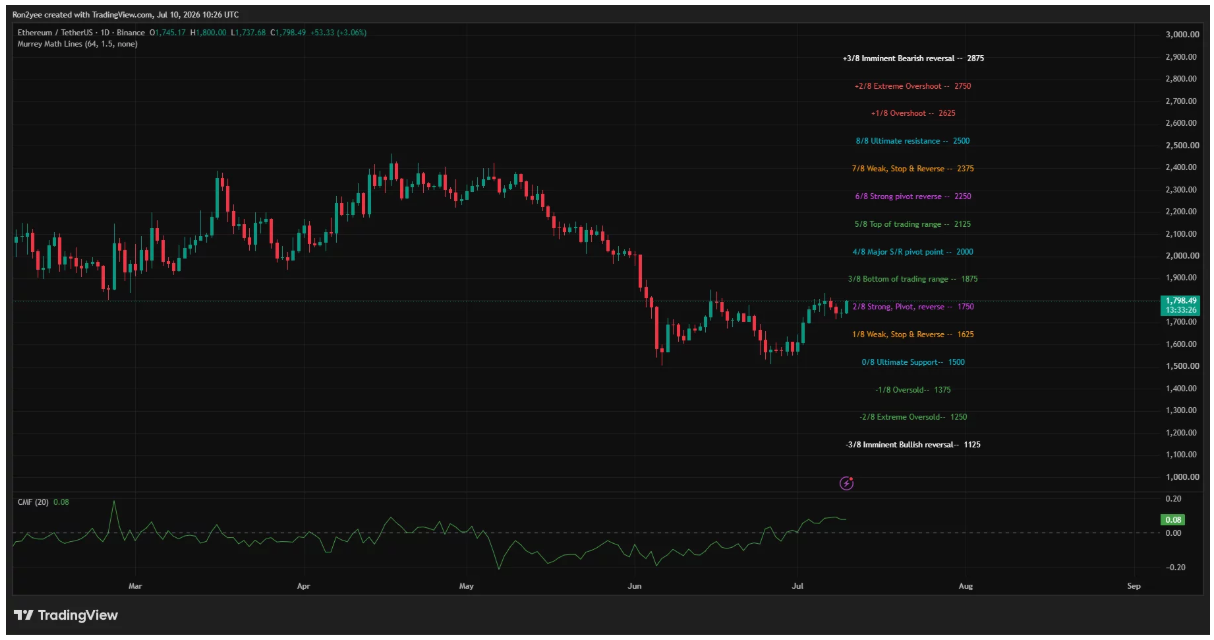 Ethereum technical indicators show compressed momentum across shorter trading timeframes. [Courtesy: Crypto News]
Crypto Market Sentiment Remains Greedy Despite The Pullback
Broader crypto sentiment remains relatively optimistic despite recent market weakness. Total crypto market capitalisation fell 4.28% in 24 hours. It now stands at $2.665 trillion. Bitcoin dominance remains near 59.25%. The Fear & Greed Index currently reads 65, signalling Greed.
This creates an interesting divergence between market sentiment and total capitalisation. On-chain activity also provides mixed signals across Ethereum’s decentralised exchanges. Uniswap V3 fees fell 29.47% daily.
However, they remain up 165.82% over seven days. They are also up 102.05% over 30 days. Uniswap V4 fees increased 15.95% daily. They have risen 169.95% over the past month.
Bullish And Bearish Scenarios For Ethereum
The bullish scenario depends on ETH holding the daily pivot. Buyers would then need to clear $2,480.36. A successful breakout could support further upside towards $2,632.77. Momentum confirmation would strengthen this scenario.
The bearish case begins with a decisive move below $2,443.31. Sellers could then target lower technical support. Losing the hourly EMA20 and EMA50 cluster would add pressure. A break beneath $2,437.32 could provide additional confirmation.
However, the daily trend remains stronger than the intraday structure. This creates conflicting signals for traders. The daily chart favours bulls. Shorter timeframes favour patience. The next decisive break could therefore shape Ethereum’s near-term direction.
Ethereum Price Outlook Favours Patience Before The Next Break
Ethereum’s current setup combines strong trend momentum with clear overbought risk. The daily RSI14 at 76.06 is the biggest warning signal. Yet ETH remains well above its major moving averages.
The daily MACD also continues supporting the bullish structure. Meanwhile, hourly and 15-minute indicators show compressed volatility.
The daily ATR14 of 107.55 contrasts sharply with the shorter ranges. This suggests a larger move could emerge after consolidation ends. Traders may therefore focus on confirmation around key levels.
Holding $2,458.09 keeps the immediate bullish structure intact. Breaking $2,480.36 could strengthen upside momentum. Falling below $2,443.31 would increase reversal risks.
Conclusion
Ethereum is still showing a positive technical bias today. Still, I think you should watch risk closely. ETH is trading above the daily pivot near $2,458.09. The larger picture is supported by key moving averages.
At the same time, RSI14 is at 76.06, which suggests the market is overextended. Inside the day, the signals lean more toward settling in than pushing higher right away.
If ETH moves through $2,480.36, the upside push may get renewed. If price slips under $2,443.31, you could see a deeper pullback instead. For now, Ethereum looks stuck between stronger daily strength and a tighter short-term range.
Next, the market should pick a direction. That move may show whether buyers can keep driving higher or whether sellers take back control.
Also Read: What SEC’s Latest Crypto Proposal Means for the Future of Digital Markets
Frequently Asked Questions
Q1: Is Ethereum Currently Overbought?
A1: Yes, Ethereum’s daily RSI14 has reached 76.06. This signals strong momentum but also increases potential pullback risk.
Q2: What Are Ethereum’s Key Resistance Levels?
A2: The immediate resistance level is $2,480.36. The daily upper Bollinger Band provides a larger reference at $2,632.77.
Q3: What Are Ethereum’s Key Support Levels?
A3: The daily pivot at $2,458.09 provides the first important reference. The next support level is $2,443.31, followed by lower technical areas.
Disclaimer:
This is for information only. It is not financial advice. Crypto prices can move fast and with big swings. Technical readings can turn out wrong and are not sure forecasts. You should review your own finances, your risk comfort, and your goals. Do your own research before you act on anything in crypto. If needed, talk to a licensed financial professional. Past results do not promise future outcomes.
Source Links